How are the two major chains doing in the last period? Is the Bitcoin dominance growing or Ethereum closing in? Let’s take a look.
We will be looking at data for:
- Inflation and supply
- Active wallets
- Number of daily transactions
- Fees
- Market cap and BTC dominance
The data is extracted from https://www.blockchain.com/charts and https://ethscan.com/, for the period 2015 – 2025.
Bitcoin has been around since 2009, but Ethereum started with operation in 2015 and from then forward we will be making comparisons.
Inflation and Supply
The limited supply of Bitcoin, the 21M cap, is one of its main features. The Bitcoin monetary policy is well known. Ethereum on the other hand has also taken steps in that direction and it has been even deflationary at one point. Here is the chart for the supply of the two tokens.
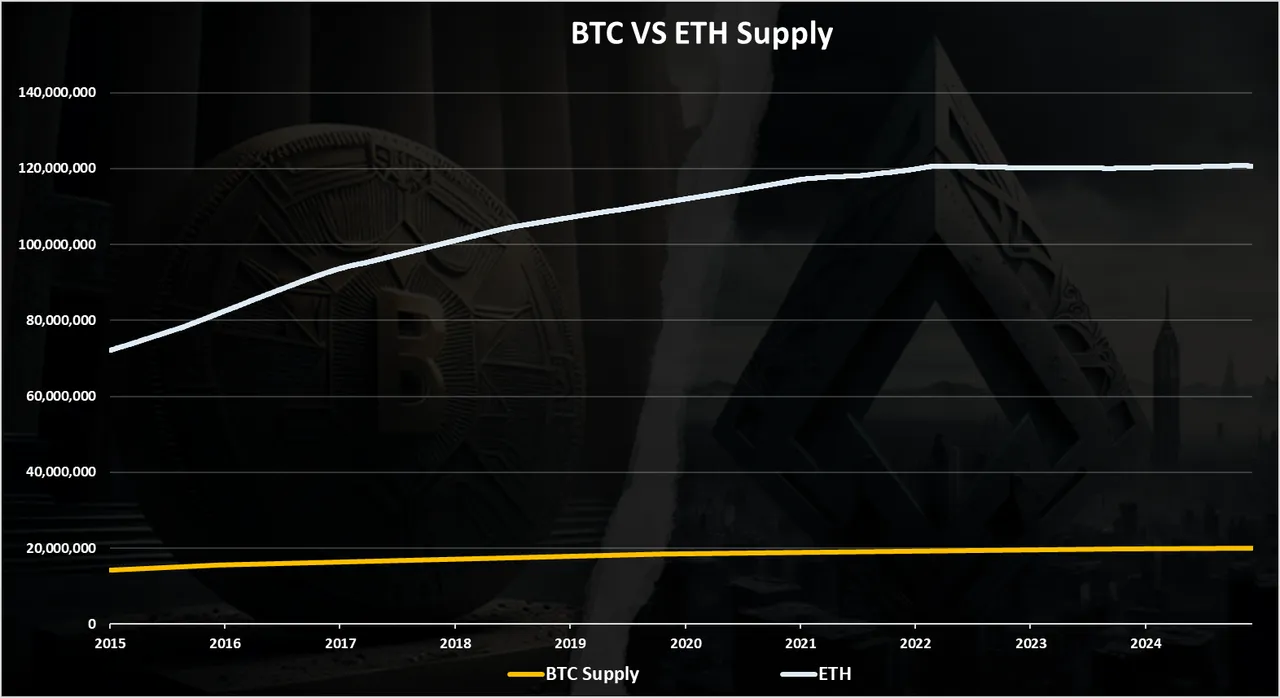
Bitcoin is now at 19.9M supply with 95% of its supply now minted and only around 5% more to go. Ethereum is at 120M, six times more tokens in circulation than Bitcoin and it has been around the 120M level since the merge of 2022.
Inflation
When we extract the chart for the inflation of the two tokens, for easier comparison we have this:
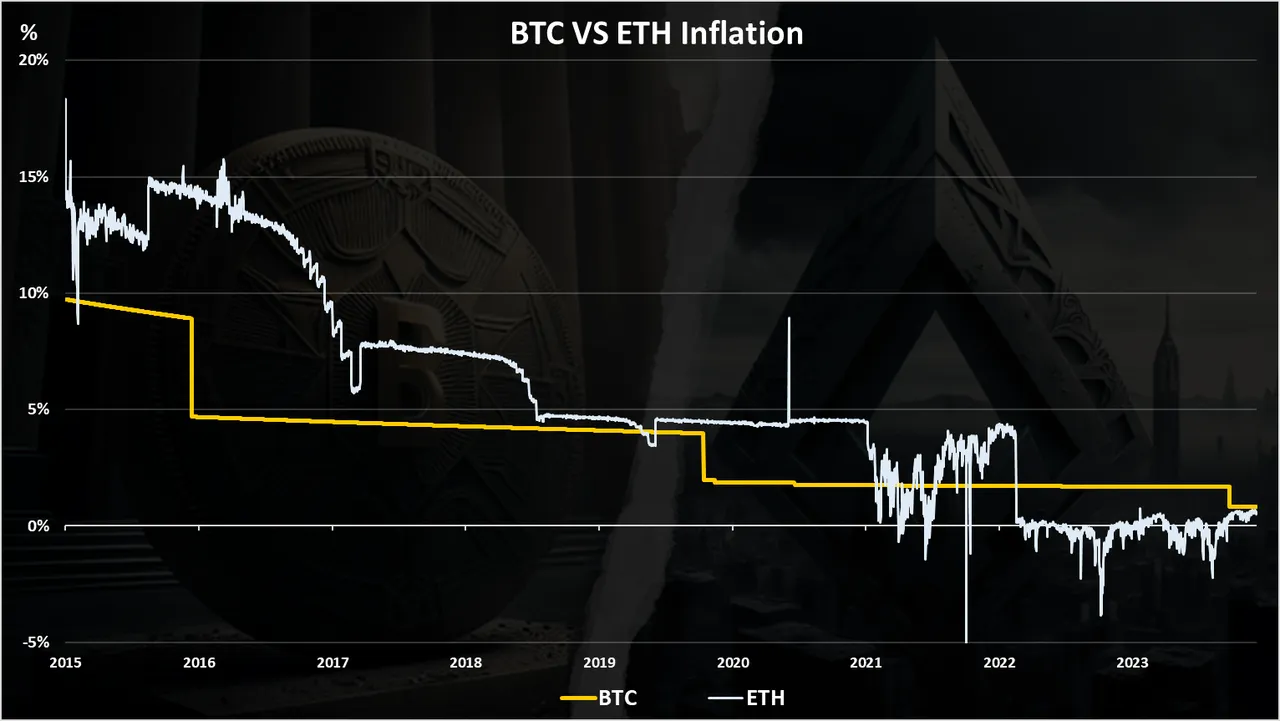
We can see that back in 2015, when Ethereum was launched, both of the tokens had inflation levels of 10% and 15%. Quite high for both. Then in 2016 the Bitcoin halving happened, and Bitcoin went down to less than 4%. Ethereum also had a drop in 2017 to around 7%. In the last years Bitcoin has followed is well known pattern and is now at 0.8% inflation after the April 2024 halving. Ethereum has also reduced its inflation a lot in the last period, especially after the Proof of stake move and now has a 0.43% bas inflation. When activities are high, a part of the inflation on ETH is burned so it goes lower and sometimes even negative.
In the very last period, the last months, we can notice that the inflation rate for these two is now very close.
Active Wallets
How about active wallets? How many have been used? Here is the chart.
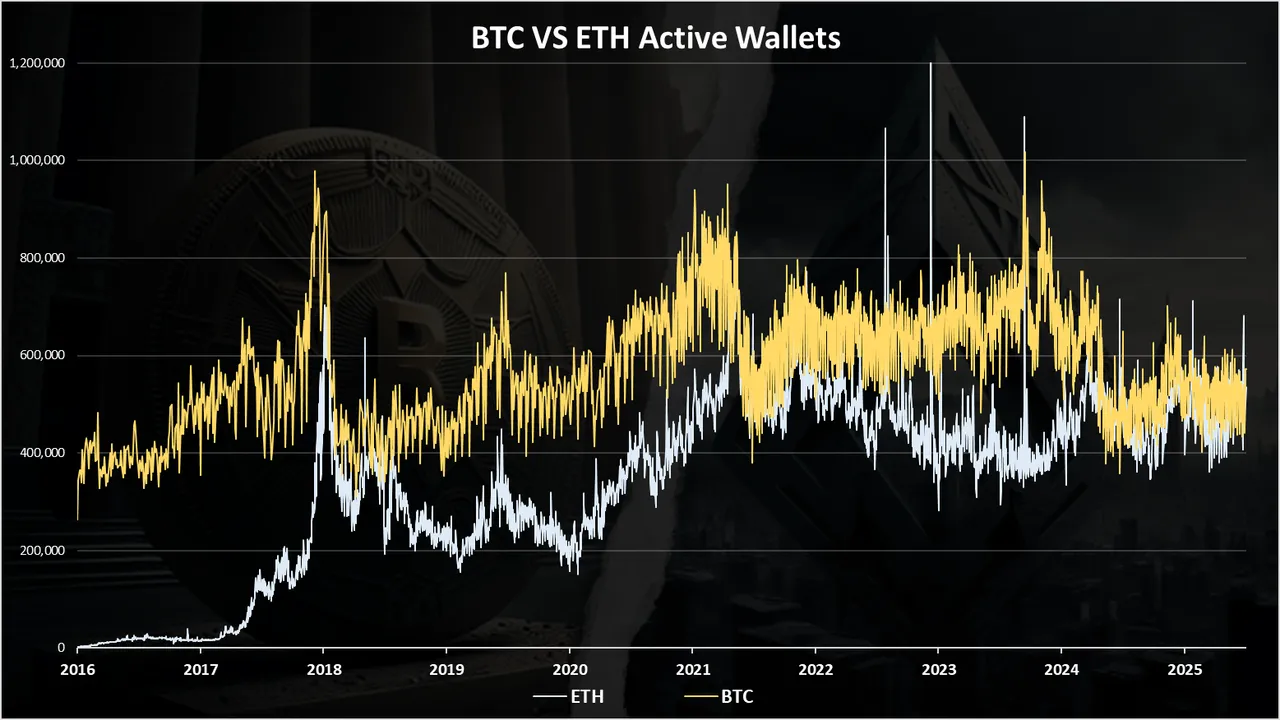
When we look at the numbers of active wallets Bitcoin is in a small lead. Ethereum came close to Bitcoin in the previous bull run, at the end of 2017 and the beginning of 2018. On a few occasions ETH has surpassed BTC in number of daily active wallets. It was close again in 2021, but since then BTC has performed better.
When we zoom in 2023-2025 we get this:
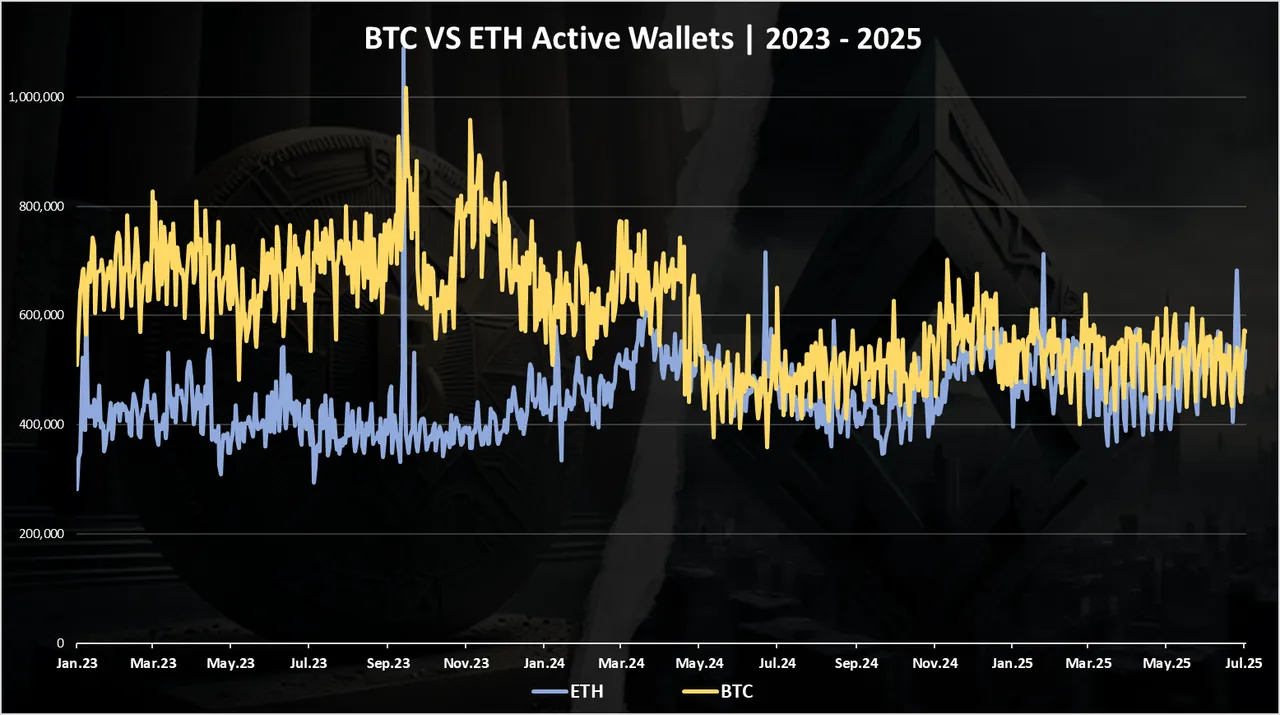
A very close race in the last year with both of the networks in the range of 400k to 600k daily active wallets.
Bitcoin had some spikes in the period, usually with the adoption of the second layer tokens boosted by the Ordinals protocol.
Number of Daily Transactions
Here is the chart for the number of daily transactions.
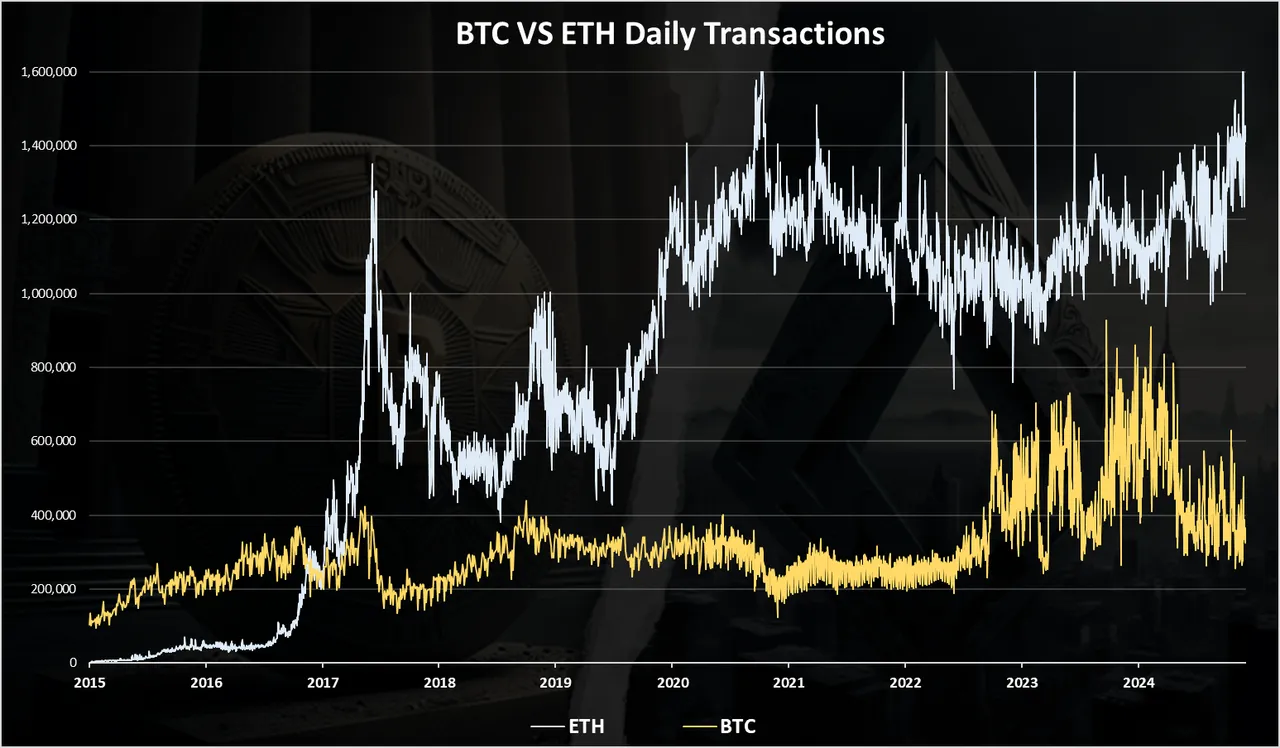
In terms of daily transactions Ethereum is in the lead in front of Bitcoin.
Ethereum has overtaken Bitcoin in 2017 and has been leading since then. In the last months the tx on Ethereum have increased and have reached 1.6M. On the Bitcoin network the transactions have been low around the 500k mark, after the previous volatility it had due to the L2 experiments, tokens and NFTs.
Fees
The chart for the fees looks like this.
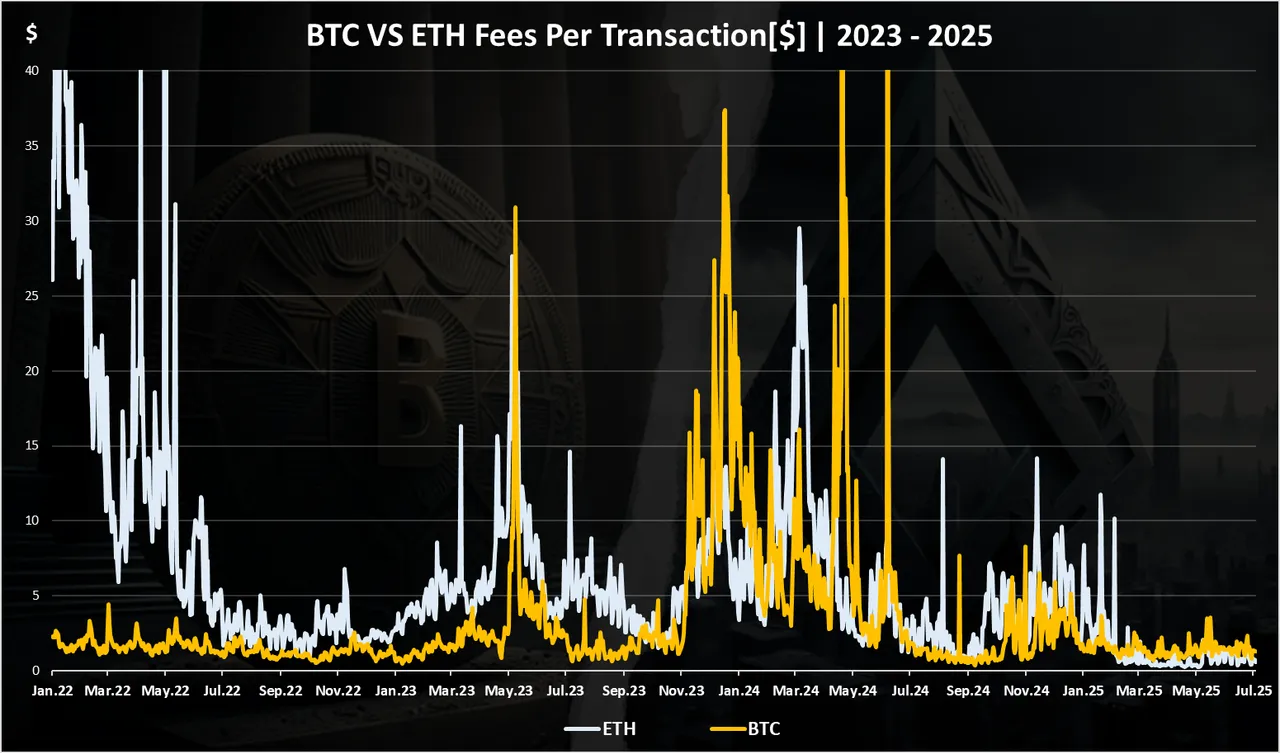
These are the average daily fees per transaction in $ value.
We can notice the volatility in the fees. Back in 2022 especially on the Ethereum network. The fees on Ethereum were as high as 50$, and have dropped to few dollars at the end of 2022. In 2023 fees on Ethereum increased and this has continued in 2024 with the average fees on Ethereum close to 20$. But in the last months the fees on Ethereum are record low levels, less even than Bitcoin.
For Bitcoin, we can notice the sharp increase in May 2023. This is due to the NFS and tokens. At one point the fees on the Bitcoin network reached 30$. Another sharp move in November and December 2024and a retrace in the last months.
Bitcoin fees are now in the range of one to two dollars, while on Ethereum they are bellow one dollar.
Bitcoin and Ethereum Market Cap
The interesting topic for Bitcoin and Ethereum is the flippening, or will Ethereum surpass Bitcoin in terms of market cap and become no.1 crypto.
Here is the historical chart for the Bitcoin VS Ethereum market cap.
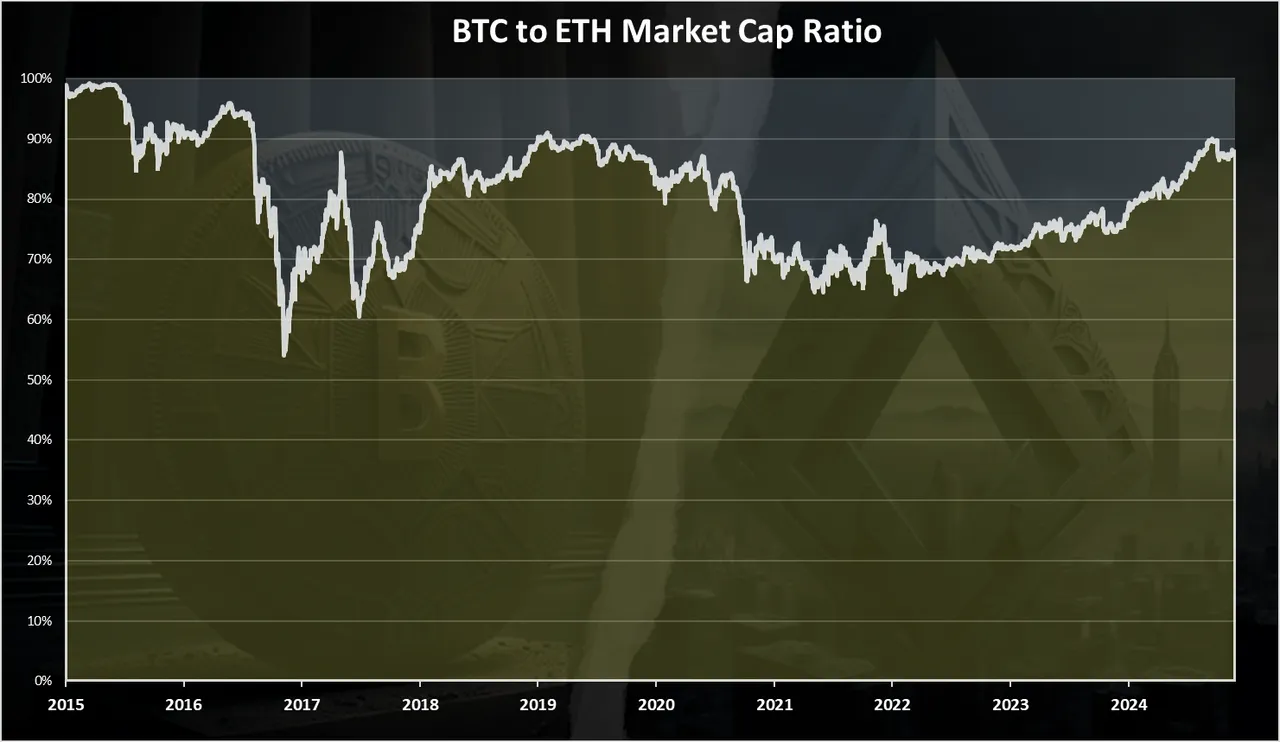
We can see that at first in 2015 when Ethereum was launched it had a very low market cap compared to Bitcoin. As time progressed in the bull run of 2017 Ethereum has come close to the market cap of Bitcoin on few occasions, but only for a short period of time.
In the last years the Bitcoin dominance has been growing from around 70% back in 2021 to close to 90% against Ethereum in 2025. It has been quite the ride for Bitcoiners, but not exactly the same for Ethereum holders. Will Ethereum manage to increase its market share going forward? It remains to be seen.
The pie chart looks like this:
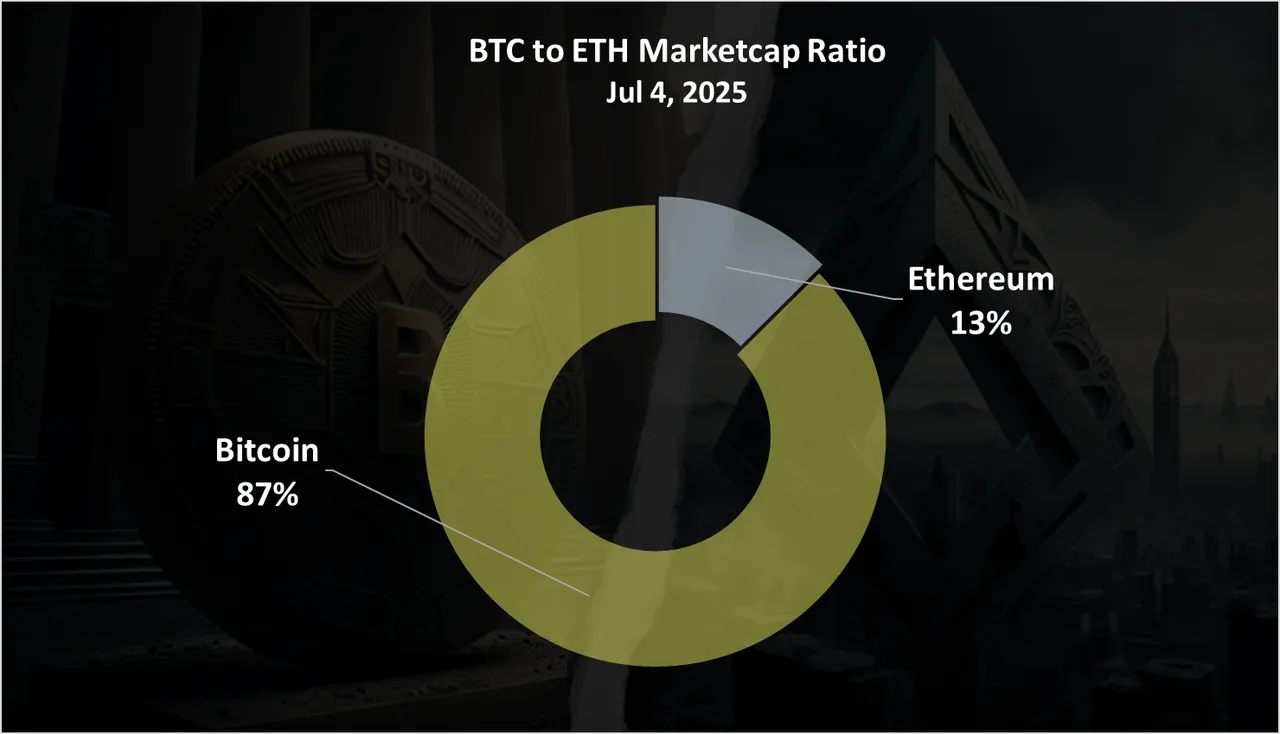
At the moment Bitcoin is around 2.1 trillionmarketcap while Ethereum is around 320 billions.
Summary
These two are now close when it comes to inflation with both tokens bellow one percent yearly inflation. Bitcoin is leading when it comes to active wallets, while Ethereum is in the lead for the number of transactions, although BTC has seen some increase in activity in the last period. The fees on the Bitcoin network have gone up, in the period of NFTs and tokens, but are low in the last months, while on the Ethereum network they are currently at record low levels, lower than BTC.
When it comes to the market cap, the 70% - 30% ratio has held for a long time, but now Bitcoin has increased its dominance to 87% to 13%.
While these two chains are now totally different in design and function, Bitcoin seems stronger than ever and shows it can do things that Ethereum does as well. Plus the overall ETF approval and the Bitcoin treasury strategy companies like MicroStrategy are doing has pushed Bitcoin higher.
All the best
@dalz