HBDStats now has Hive stats!
Since my last update back in April I have added more elements to the web. Let’s take a look!
Let’s take a look.
First and foremost, there is now a new tab on the top with the HBD and HIVE options:

When you toggle on the HBD tab there are the options:
- Debt
- Savings
- HBD Supply
- DHF Supply
- Cumulative
- Interest
Most of these were there before the update, except for the interest chart, that is now new.
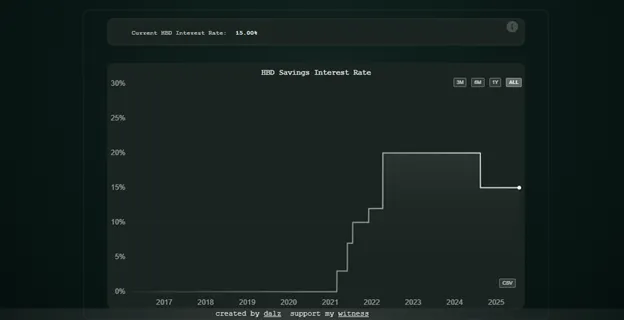
Here we can see the historic move of the interest rate for HBD in savings. We can see that prior to 2021 there was no interest for HBD, then a series of few adjustments on the upside, up to 20% and then a drop to the current 15%.
Having historic HBD interest is a vital parameter that users holding HBD in savings should have in mind, and to note that this parameter is dynamic and has seen changes in the past, based on what then users can bring their conclusions about HBD allocation.
Hive Stats
On the totally new addition, the hive tab, currently we have this:
- Hive Supply
- Hive Power
- Active Accounts
- Transactions
The Hive supply is obviously a key parameter, as for any other blockchain.
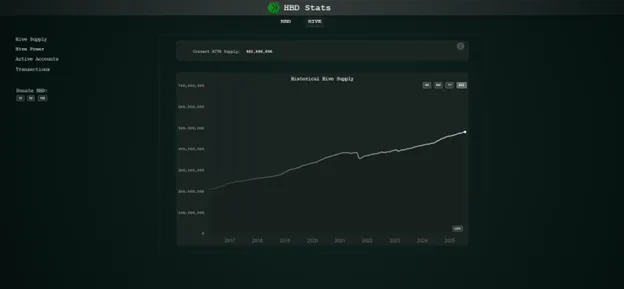
The supply and the inflation rate are something that is closely monitored from the community, as it represents the debasement of the token holders, and when corelated to the staking rewards it gives users, info are they beating inflation with their earnings. On top of this there is info on the current supply data. As for the other chart, users can change the timeframe to 1Y and less. Additionally, as for the other charts, there is a download button for the token supply in CSV form, with daily data back from 2016 that anyone can use in their analysis.
Going forward I will add another chart with the inflation data represented in % units.
Next on the list is the Hive Power data:
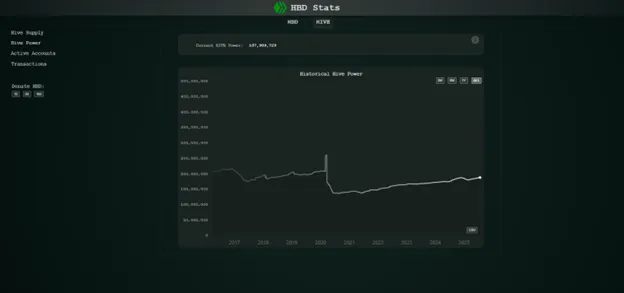
Another key parameter is how much of the token supply is staked, or in this case powered up. Here we have an overview from the very beginning of the chain back in 2016. The option for choosing a different timeframe is here as well and the download button.
Another interesting parameter that can be added here is the share of the Hive Powered up, currently at 39%. A historic chart can be a good representation for this as well.
Daily Active Accounts
Another key parameter, daily active accounts!
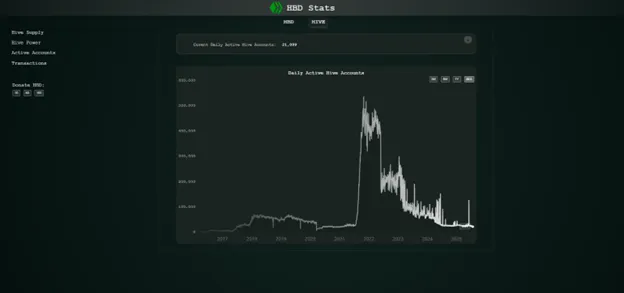
Here as well we have a historical data going all the way back. Note that the number of active accounts is for all types of operations, and the massive spike back in 2021 is due to the explosion in the activity on Splinterlands. Going forward a breakdown of the active accounts by operation can be included, like account posting, voting, custom_json, transfers, etc.
Number of Transactions per Day
Another key parameter, the activity on the chain, or the number of transactions per day.
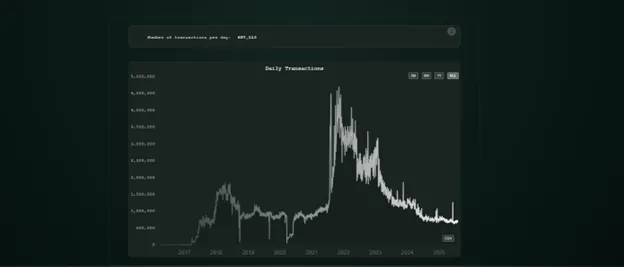
This chart as for the active accounts includes all types of operations made, the options for adding a further breakdown by type of operations can be implemented here as well.
Future Plans
As already pointed out, I do plan to add a few more charts, especially on the Hive side, including the inflation rate, share of Hive powered up, and breakdown of the activity and transactions by type of operation.
On the HBD side, there can be more aditions, like daily paid HBD interest, DHF payouts, top holders etc.
Another major addition I plan to add is data on the Splinterlands tokens, SPS and DEC. I do post now from time to time about the supply and inflation of these tokens, but getting data on the historical supply can be a challenge. There are APIs that Splinterlands provide for the current supply, from where I can make daily snapshots and create a timeseries.
Support the Project
The web has a nice amount of data and charts now, from the early beginning, where there was only one chart. It is a full stack web, with a backend, its own database and APIs. While I do this for personal pleasure, growth and to upscale my skills, any appreciation is more than welcomed. It will for sure boost motivation and speed up the development :). I dont know exactly how many hours I have put in it till now, but it is a lot. For sure I do plan to put all the code on github, and the data is free to be downloaded even now, for every chart.
I have integrated donation buttons in HBD, for anyone that finds the provided data useful. The transactions lead to keychain link with all the safety measures in place, first choose account, and then confirm the transaction.

If you have any additional proposals, feedback and addition you want to see in the web, let me know in the comments!
All the best
@dalz