~~~ La versione in italiano inizia subito dopo la versione in inglese ~~~
ENGLISH

04-08-2025-Materials Technology - Graph, Metal, and Temperature[EN]-[IT]
With this post, I would like to provide a brief introduction to the topic in question.
(code notes: X-99)
Graph, Metal, and Temperature

Image created with artificial intelligence, the software used is Microsoft Copilot
Introduction
When we talk about materials technology, we mean the study of applied sciences related to the transformation of raw materials into products for use or consumption.
Essentially, this subject deals with the manufacturing processes applied to raw materials to transform them. Manufacturing processes can be chemical or mechanical.
In materials technology, we often see graphs showing the behavior of metals in relation to temperature.
Typical Graph
Let's take the following graph, for example, which is a typical graph we might encounter when studying materials technology, and try to explain what it is.
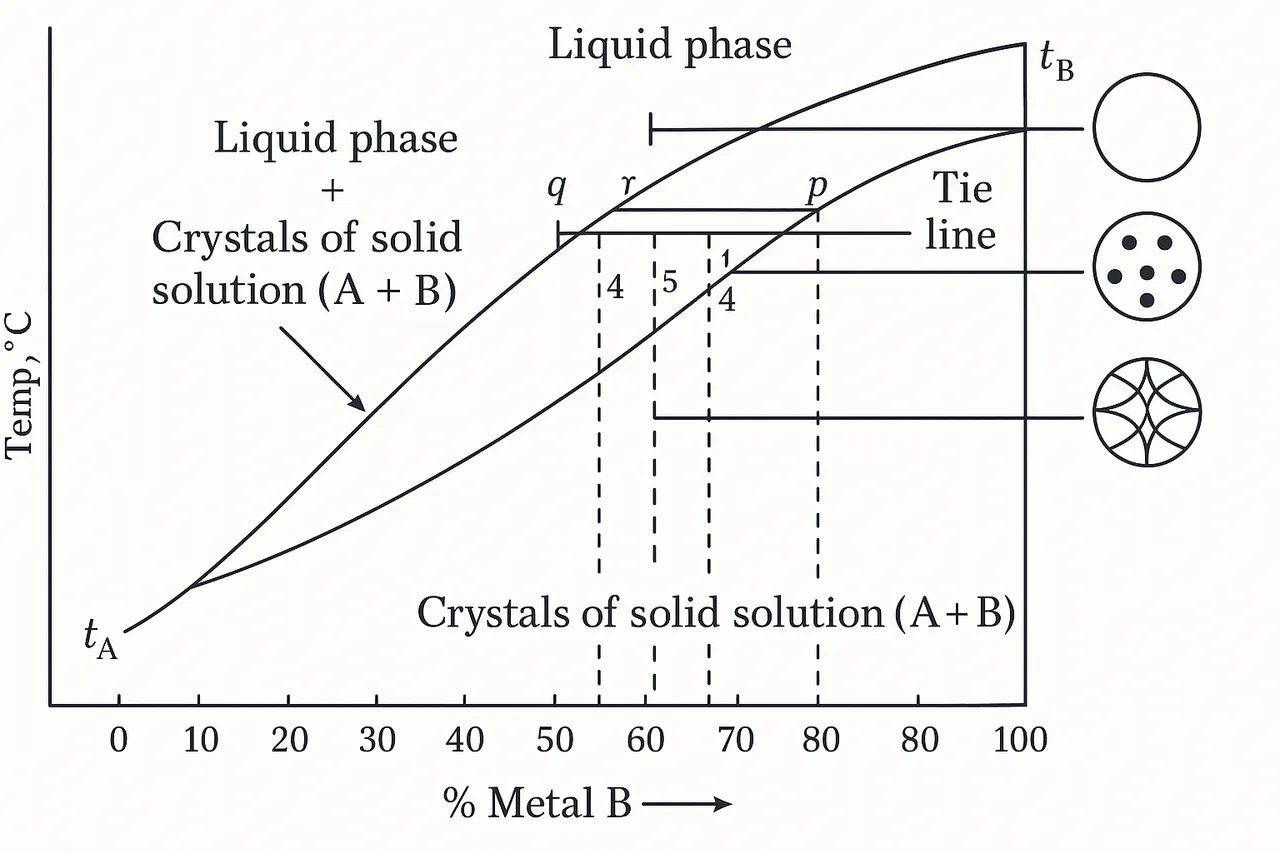
immagine creata con l’intelligenza artificiale, il software usato è ChatGPT
This graph is a binary phase diagram with complete solidification.
This diagram shows the thermal behavior of an alloy composed of two metals (represented in the graph by the letters A and B) as a function of temperature and the percentage composition of B.
The Phases
The graph above shows three phases, starting from the top:
- the liquid phase
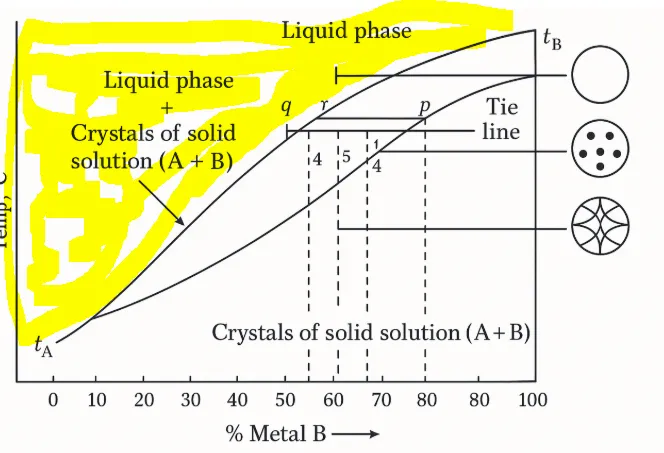
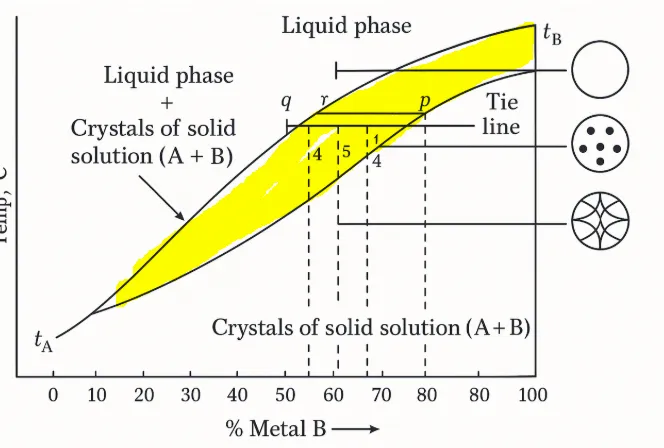
- liquid + coexistence zone solid
-solid zone
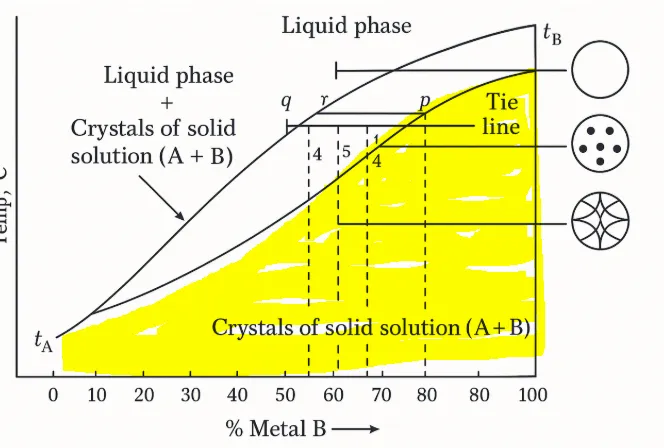
Significant Curves
There are two very significant curves in this graph.
The upper curve separates the completely liquid phase from the coexistence zone, while the lower curve separates the completely solid phase from the coexistence zone. The part below this curve represents the completely solidified material.
The representative circles
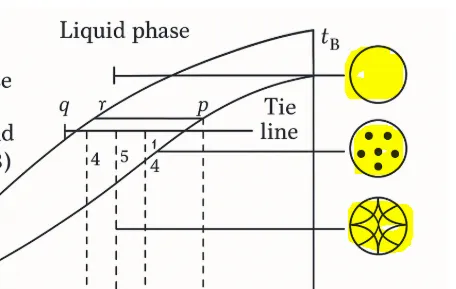
These circles initially seem untranslatable, but they are actually very simple.
Starting from the top, they represent:
- Empty circle (the one above) is the liquid phase.
- Circle with dots is the mixed phase, that is, the one with solid crystals suspended in the liquid.
- Circle with a lattice represents the completely solid structure, the one with formed crystals.
How to read it
Let's imagine we have an alloy of metal A+B with metal B at 60%.
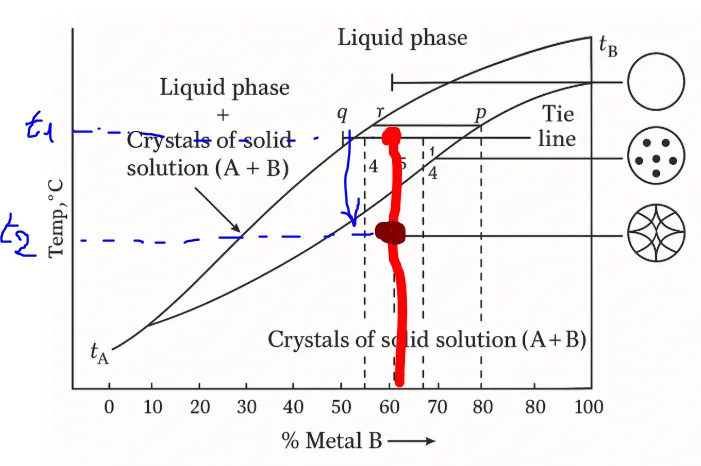
At temperature t1, alloy A+B is in the intermediate phase, also known as the mixed phase, where there is a mixture of liquid and solid crystals.
The graph shows that if we lower the temperature to t2, our alloy, with 60% metal B, will solidify.
Conclusions
The study of materials technologies helps us select suitable materials based on technical and production constraints, but above all, it allows us to perform diagnostic activities and technical assessments in the chemical-industrial or mechanical sectors.
Question
Did you study materials technologies in school? Did you have to study any materials for work reasons?
![]()
ITALIAN

04-08-2025-Tecnologie dei materiali - grafico, metallo e temperatura[EN]-[IT]
Con questo post vorrei dare una breve istruzione a riguardo dell’argomento citato in oggetto
(code notes: X-99)
grafico, metallo e temperatura
immagine creata con l’intelligenza artificiale, il software usato è Microsoft Copilot
Introduzione
Quando parliamo di tecnologia dei materiali intendiamo lo studio delle scienze applicate relative alla trasformazione della materia prima in prodotti di impiego o di consumo.
Sostanzialmente questa materia parla dei processi di lavorazione applicati alla materia prima utili per trasformarla. I processi di lavorazione possono essere di tipo chimico o meccanico.
In tecnologia dei materiali vedremo spesso grafici in cui vengono mostrati i comportamenti dei metalli in relazione alla temperatura.
Grafico tipico
Prendiamo ad esempio il seguente grafico, che è un tipico grafico che potremmo incontrare studiando la tecnologia dei materiali, e proviamo a spiegare cosa è
immagine creata con l’intelligenza artificiale, il software usato è ChatGPT
Questo grafico è un diagramma di fase binario a solidificazione completa.
In questo diagramma viene mostrato il comportamento termico di una lega costituita da due metalli (rappresentati nel grafico con le lettere A e B), in funzione della temperatura e della composizione percentuale di B.
Le fasi
Nel grafico qui sopra sono mostrate tre fasi, a partire dall'alto abbiamo:
-la fase liquida
-zona di coesistenza liquido + solido
-zona solida
Curve significative
In questo grafico ci sono due curve molto significative.
La curva in alto separa la fase completamente liquida dalla zona di coesistenza, mentre la curva in basso separa la fase completamente solida dalla zona di coesistenza. La pare sottostante a questa curva rappresenta il materiale completamente solidificato.
I cerchi raffigurativi
Questi cerchi inizialmente sembrano intraducibili, ma in realtà sono semplicissimi.
Partendo dall'alto essi rappresentano:
-Cerchio vuoto (quello sopra) la fase liquida.
-Cerchio con puntini è la fase mista, cioè quella con cristalli solidi sospesi nel liquido.
-Cerchio con reticolo rappresenta la struttura completamente solida, quella con i cristalli formati.
Come si legge
Pensiamo di avere una lega di metallo A+B con il metallo B al 60%.
Alla temperatura t1 la lega A+B si trova nella fase di mezzo, ovvero quella chiamata fase mista, cioè dove esiste una miscela di liquido e cristalli solidi.
Il grafico ci mostra che se abbassiamo la temperatura fino a raggiungere t2, la nostra lega con il 60% di metallo B, si solidificherà.
Conclusioni
Lo studio delle tecnologie dei materiali ci aiuta a selezionare materiali adeguati a seconda dei vincoli tecnici e produttivi, ma soprattutto ci permette di effettuare attività diagnostiche e perizie tecniche nei settori chimico‑industriali o meccanici
Domanda
Avete studiato a scuola tecnologie dei materiali? Avete dovuto studiare dei materiali per motivi di lavoro?
THE END