~~~ La versione in italiano inizia subito dopo la versione in inglese ~~~
ENGLISH

17-07-2025 - Mathematical Analysis - Functions of Several Variables [EN]-[IT]
With this post, I would like to provide a brief introduction to the topic mentioned above.
(code notes: X-36)
Functions of Several Variables
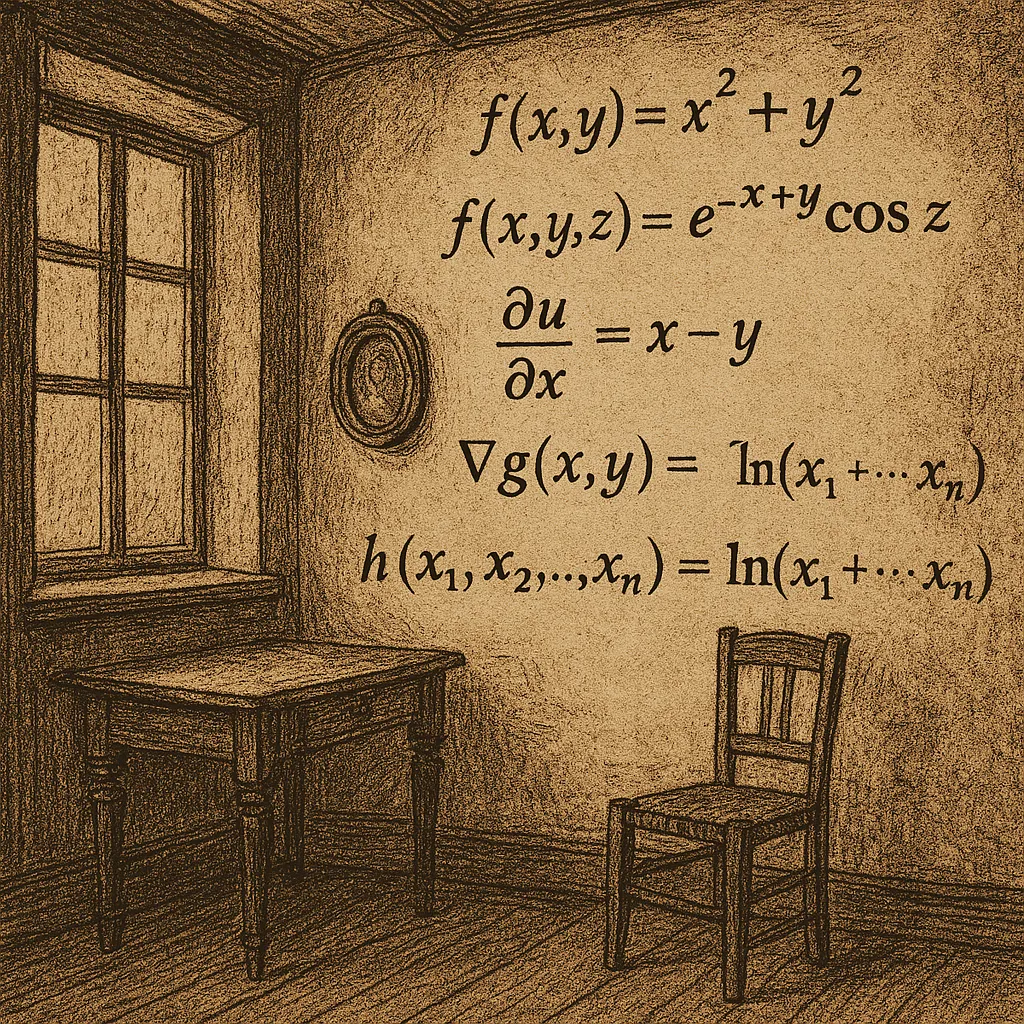
Image created with artificial intelligence, the software used is Microsoft Copilot
Introduction
We often study functions in school and struggle to complete the 1,000 exercises we're given. Then, anyone who continues their studies in engineering or mathematics will eventually encounter something unusual in the field of functions and come across functions of multiple variables.
They are extensions of normal one-variable functions. The spaces on which functions of multiple variables operate are larger, and each point has multiple coordinates.
In this case, we're really starting to get complicated!
The simplest two-variable function
Below, I show what can be considered the simplest two-variable function.
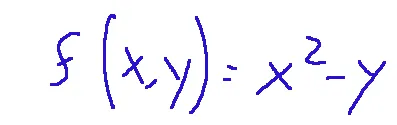
In this function, we have that (x,y) can vary in a generic way, the domain is the whole of R, and there are no restrictions on x,y. The range is over the entire R, and the function can be made to tend to +∞.
And now are you ready to see the graph of this function? Did you realize it will be multidimensional?
Below is the graph of the function where we have z=x^2-y considering it for -3<=x and y<=3.
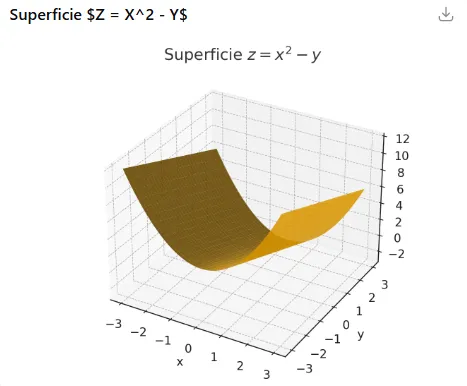
You can see the quadratic curvature in the x-direction and the constant slope along the y-direction.
Image created with artificial intelligence, ChatGPT software used
Two-variable function with sine and cosine
Now let's try to push this further, moving towards more complex forms.
Let's try the following function:
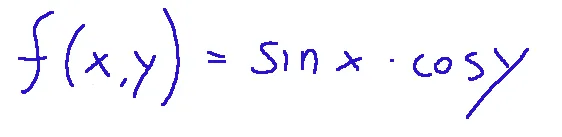
The domain will be the entirety of R (the set of real numbers) without any restrictions. This function will have a periodicity identified in the range of 2π in x and 2π in y.
Get ready to see the magical graph of this two-variable function below.
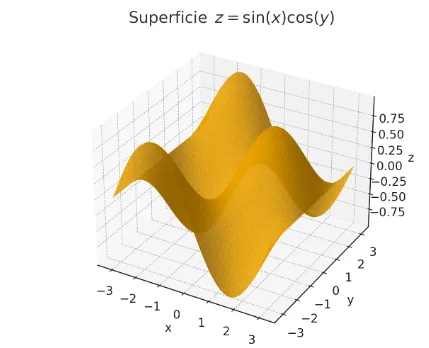
Image created with artificial intelligence, ChatGPT software used
The graph shows a regular dune surface where sinusoidal waves along x are multiplied by cosine waves along y.
This creates a wavy pattern that extends periodically in both directions and gives an idea of how mathematics can actually express forms that are pleasing to the eye.
Gaussian Dome
We can't conclude without mentioning the Gaussian dome.
Carl Friedrich Gauss is considered one of the greatest mathematicians of all time. He was born in Germany in 1777 and was a precocious genius. It's said that as a child, he would correct his father's homework. I've never figured out whether this is a legend or the truth, but anyone who knows what Gauss did in class at age 9 might easily believe the story told above is true.
Anyway, let's now consider the function that expresses the Gaussian dome.
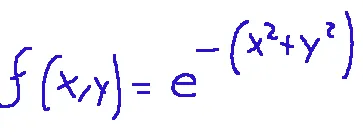
This function has a range of 0<f<=1, and the maximum value f(0,0)=1 is found at the center.
Let's now reveal the graph of the famous Gaussian dome.
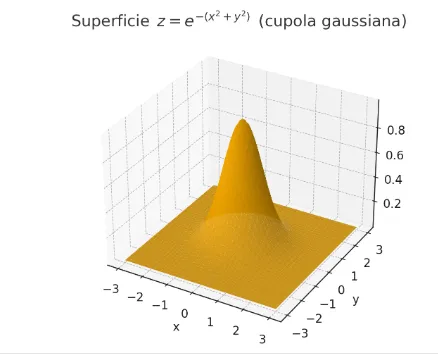
Image created with artificial intelligence, ChatGPT software used
The graph always has positive curvature with a strictly convex surface and no saddle points.
Conclusions
Functions of several variables are used in physics to describe vector or potential fields in two or three dimensions. They are also used in engineering to model systems dependent on multiple parameters.
Question
Leonhard Euler is known for his famous calculations of the orbits of planets and comets, but did you know that as early as 1700 he also studied surfaces z = f(x,y), that is, functions of several variables?
![]()
ITALIAN

17-07-2025 - Analisi Matematica - Funzioni di più variabili [EN]-[IT]
Con questo post vorrei dare una breve istruzione a riguardo dell’argomento citato in oggetto
(code notes: X-36)
Funzioni di più variabili
immagine creata con l’intelligenza artificiale, il software usato è Microsoft Copilot
Introduzione
Spesso studiamo a scuola le funzioni e fatichiamo a fare i 1000 esercizi che ci vengono dati. Poi chi prosegue con gli studi di ingegneria o matematica, ad un certo punto incontra anche qualcosa di particolare nell'ambito delle funzioni e si imbatte nelle funzioni a più variabili.
Esse sono delle estensioni delle normali funzioni a una variabile. Gli spazi su cui operano le funzioni a più variabili sono più vasti ed ogni punto ha coordinate multiple.
In questo caso, iniziamo proprio a complicarci la vita!!
La funzione a due variabili più semplice
Qui di seguito mostro quella che può essere considerata la funzioni a due variabili più semplice.
In questa funzione abbiamo che (x,y) possono variare in modo generico, il dominio è su tutto R e non ci sono restrizioni su x,y. Il range è su tutto R e la funzione si può far tendere a +∞
E ora siete pronti a vedere il grafico di questa funzione? Avete capito che sarà a più dimensioni?
Qui di seguito il grafico della funzione dove avremo z=x^2-y prendendolo in considerazione per -3<=x e y<=3
si vede la curvatura quadratica nel senso di x e la pendenza costante lungo y.
immagine creata con l’intelligenza artificiale, il software usato è ChatGPT
Funzione a due variabili con seno e coseno
Proviamo ora a spingerci oltre, andare verso forme più complesse.
proviamo la seguente funzione:
Il dominio sarà su tutto R (insieme dei numeri reali) senza nessuna restrizione. Questa funzione avrà una periodicità identificata nel range di 2π in x e 2π in y.
Preparativi a vedere qui sotto il magico grafico di questa funzione a due variabili.
immagine creata con l’intelligenza artificiale, il software usato è ChatGPT
Il grafico mostra un superficie a dune regolari dove ci sono onde sinusoidali lungo x moltiplicate per onde cosinusoidali lungo y.
Si viene a creare un pattern ondulato che si estende periodicamente in entrambe le direzioni e da l'idea di come la matematica possa in realtà esprimere anche forme piacevoli allo sguardo.
Cupola Gaussiana
Non possiamo concludere senza citare la cupola Gaussiana.
Carl Friedrich Gauss è considerato uno dei più grandi matematici di tutti i tempi. Nacque in Germania nel 1777 e fu un genio precoce. Si narra che da bambino era lui che correggeva i compiti del padre. Non ho mai capito se questa sia una leggenda o la verità, ma chi sa cosa fece in classe Gauss a 9 anni potrebbe tranquillamente pensare la storia raccontata prima sia vera.
Comunque, prendiamo ora in considerazione la funzione che esprime la cupola gaussiana.
Questa funzione ha un range che è 0<f<=1 ed il valore massimo f(0,0)=1 si trova al centro.
Sveliamo ora il grafico della famosa cupola Gaussiana
immagine creata con l’intelligenza artificiale, il software usato è ChatGPT
Il grafico ha una curvatura sempre positiva con una superficie strettamente convessa e non ha punti di sella.
Conclusioni
Le funzioni di più variabili sono applicate in fisica per descrivere campi vettoriali o potenziali in 2 oppure 3 dimensioni. Esse vengono usate anche in ingegneria nella modellazione di sistemi dipendenti da più parametri.
Domanda
Leonhard Euler (Eulero) è conosciuto per i suoi famosi calcoli delle orbite di pianeti e comete, ma lo sapevate che egli studiò già nel 1700 anche le superfici z=f(x,y), cioè proprio le funzione a più variabili?
THE END