~~~ La versione in italiano inizia subito dopo la versione in inglese ~~~
ENGLISH

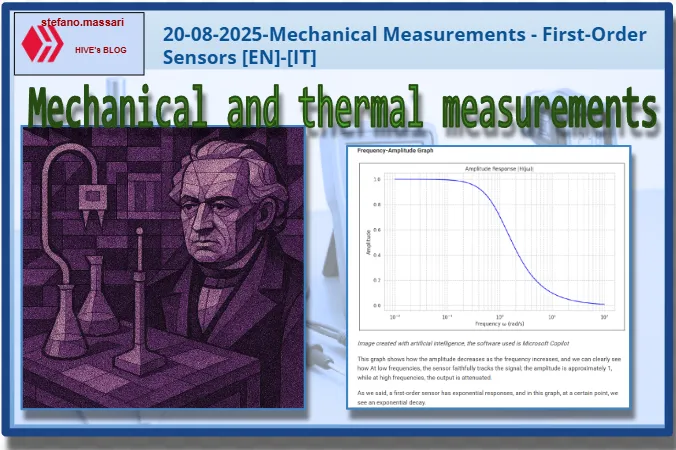
20-08-2025-Mechanical Measurements - First-Order Sensors [EN]-[IT]
With this post, I would like to provide a brief introduction to the topic in question.
(code notes: X-83)
First-Order Sensors

Image created with artificial intelligence, the software used is Microsoft Copilot
Introduction
One of the key concepts in dynamical systems theory is the frequency response function of a first-order sensor.
First, let's define what a first-order sensor is.
It is a sensor characterized by an exponential response when the measured quantity changes suddenly.
The behavior of a first-order sensor can be described by the differential equation shown below.
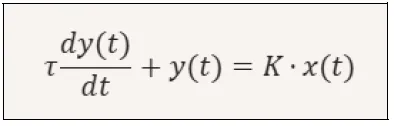
Where:
y(t) = sensor output (e.g., voltage, signal)
x(t) = input (e.g., temperature or pressure)
K = sensor's static gain
τ = time constant (indicates how quickly the sensor responds)
First-order sensors can be thermocouples, pressure sensors, and level sensors.
The dynamic behavior of a first-order sensor means that when the input signal changes abruptly, the sensor does not immediately respond to the change. Generally, the sensor's response follows an exponential curve, and after a time of approximately 3τ, the sensor has reached 95% of its final value.
Let's take an example. A thermocouple in an industrial oven must not react to every small air turbulence. Therefore, these sensors measure temperature, pressure, levels, and flow in a stable and reliable manner.
The Frequency Response Function
Now let's try to describe the frequency response function of a first-order sensor and plot its amplitude and phase.
To understand the frequency response of a first-order sensor, we apply a sinusoidal signal to the input and then analyze the steady-state output.
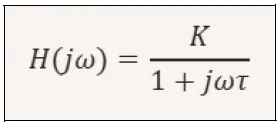
The frequency domain transfer function is as follows.
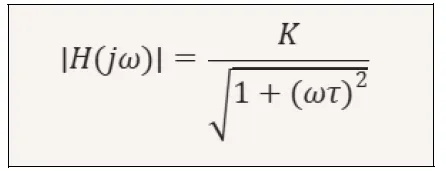
Where:
ω = frequency in rad/s
The amplitude
The amplitude, or response magnitude, is calculated as follows:
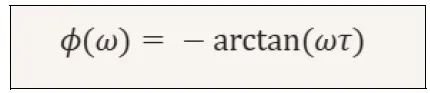
The Phase
The phase is calculated as follows.
Frequency-Amplitude Graph
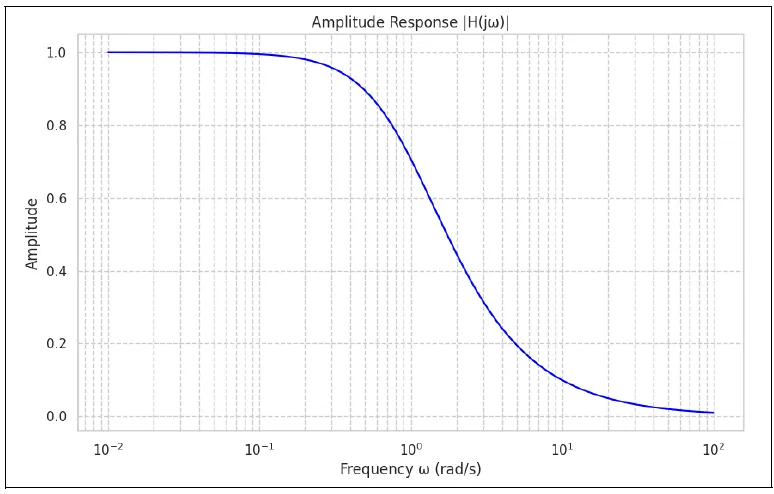
Image created with artificial intelligence, the software used is Microsoft Copilot
This graph shows how the amplitude decreases as the frequency increases, and we can clearly see how At low frequencies, the sensor faithfully tracks the signal; the amplitude is approximately 1, while at high frequencies, the output is attenuated.
As we said, a first-order sensor has exponential responses, and in this graph, at a certain point, we see an exponential decay.
Frequency-Phase Graph
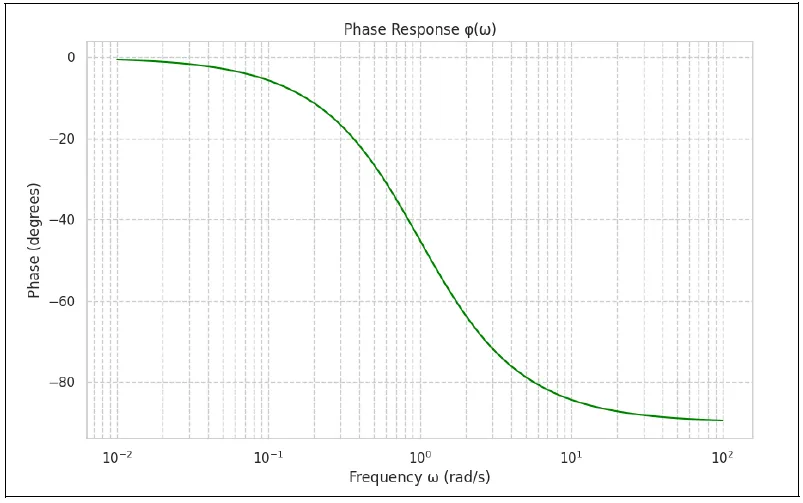
Image created with artificial intelligence, the software used is Microsoft Copilot
This graph shows how the phase starts at 0° and gradually decreases to -90°. This information tells us that there is an increasing delay between input and output as the frequency increases. In other words, as the signal frequency increases, the sensor takes longer to respond or track that signal. Essentially, at a certain point, the output is no longer synchronized with the input, but arrives later.
Conclusions
First-order sensors can measure temperature (thermistors and thermocouples), light (phototransistors), pressure (piezoelectric or capacitive transducers), and chemical concentration (pH electrodes, gas sensors).
First-order sensors are important not only for what they can measure, but also for how they respond over time. They are used in a wide variety of systems because they offer a good balance between simplicity, reliability, and predictability. The behavior of first-order sensors is easy to model mathematically, allowing most control systems to be accurately simulated or built.
Question
Have you ever heard of the Seebeck effect? Did you know that Thomas Seebeck (1770–1831) discovered what we now call the Seebeck effect (which results in the generation of thermoelectric electromotive force), the basis of thermocouples, first-order sensors?
![]()
ITALIAN

20-08-2025-Misure meccaniche - Sensori del I ordine [EN]-[IT]
Con questo post vorrei dare una breve istruzione a riguardo dell’argomento citato in oggetto
(code notes: X-83)
Sensori del I ordine
immagine creata con l’intelligenza artificiale, il software usato è Microsoft Copilot
Introduzione
Uno dei concetti chiave nella teoria dei sistemi dinamici è proprio la funzione di risposta in frequenza di un sensore di primo ordine.
Innanzitutto definiamo cosa è un sensore di primo ordine.
Esso è un sensore caratterizzato da una risposta esponenziale quando la grandezza da misurare cambia improvvisamente.
Il comportamento del sensore del I ordine può essere descritto dall’equazione differenziale qui sotto mostrata.
Dove:
y(t) = uscita del sensore (esempio tensione, segnale)
x(t) = ingresso (ad esempio la temperatura o la pressione)
K = guadagno statico del sensore
τ = la costante di tempo (indica quanto velocemente il sensore risponde)
I sensori di primo ordine possono essere termocoppie, sensori di pressione e sensori di livello
Il comportamento dinamico di un sensore di I ordine prevede che quando il segnale in ingresso cambia bruscamente, il sensore non segue immediatamente il cambiamento. Possiamo dire che generalmente la risposta del sensore segue una curva esponenziale, e dopo un tempo pari a circa 3τ, il sensore ha raggiunto il 95% del valore finale.
Facciamo un esempio. Una termocoppia in un forno industriale non deve reagire ad ogni piccola turbolenza d’aria. Quindi questi sensori misurano temperature, pressione, livelli e flusso in modo stabile ed affidabile.
La funzione di risposta in frequenza
Ora proviamo a descrivere la funzione di risposta in frequenza di un sensore del I ordine e disegnarne il grafico in termini di ampiezza e fase.
Per comprendere la risposta in frequenza di un sensore di I ordine applichiamo un segnale sinusoidale all’ingresso e poi andremo ad analizzare l’uscita in regime stazionario.
La funzione di trasferimento nel dominio della frequenza è la seguente.
Dove:
ω = pulsazione in rad/s 1
L’ampiezza
L’ampiezza ovvero il modulo di risposta si calcola nella seguente maniera:
La fase
La fase si calcola nella seguente maniera.
Grafico Frequenza-Ampiezza
immagine creata con l’intelligenza artificiale, il software usato è Microsoft Copilot
Questo grafico mostra come l’ampiezza decresce all’aumentare della frequenza e notiamo bene come a bassa frequenza il sensore segue fedelmente il segnale, l’ampiezza è circa 1, mentre a frequenze elevate l’uscita viene attenuata.
Come abbiamo detto un sensore di I ordine ha delle risposte esponenziali ed in questo grafico vediamo ad un certo punto un decadimento esponenziale.
Grafico Frequenza-Fase
immagine creata con l’intelligenza artificiale, il software usato è Microsoft Copilot
In questo grafico viene mostrato come la fase inizia da o° e scende gradualmente a -90°. Questa informazione ci dice che esiste un ritardo crescente tra ingresso e uscita al crescere della frequenza. In altre parole man mano che la frequenza del segnale aumenta, il sensore impiega più tempo a rispondere o a seguire quel segnale. Sostanzialmente l’uscita ad un certo punto non è più sincronizzata con l'ingresso, ma arriva in ritardo.
Conclusioni
I sensori di I ordine possono misurare la temperatura (termistori e termocoppie), la luce (fototransistor), la pressione (trasduttori piezoelettrici o capacitivi) e la concentrazione chimica (elettrodi per pH, sensori di gas).
I sensori di I ordine non sono importanti solo per quello che riescono a misurare, ma anche per come rispondono nel tempo. Vengono usati in tantissimi sistemi perché offrono un buon equilibrio tra semplicità, affidabilità e prevedibilità. Il comportamento dei sensori di I ordine è facile da modellare matematicamente e questo permette di simulare o costruire con precisione la maggior parte dei sistemi di controllo.
Domanda
Avete mai sentito parlare dell’effetto Seebeck? Lo sapevate che Thomas Seebeck (1770–1831) scoprì quello che oggi chiamiamo effetto Seebeck (che come conseguenza ha la generazione della forza elettromotrice termoeletttrica), base delle termocoppie, sensori di I ordine?
THE END