For anyone that's familiar with the market and the way it moves, they will always tell you that the price movement of any asset on the market is usually moving in a cycle that's shared between two periods.
The two periods are known as a period of accumulation and a period of distribution.
The state of the market at any point is either in accumulation or distribution.
If an asset in the market is not being accumulated then it is probably being distributed.
Here in this post we are going to be discussing the concepts of accumulation and distribution and how we can make use of this theories to influence our trading decisions in the financial market.
We are going to start with accumulation
Accumulation
Accumulation is an event or a series of events in the financial markets that involves traders and investors buying in to an asset with a target to sell the asset if it ever rises to a profitable price or if the asset falls to a losing price.
Either way, during an accumulation period, the market forces will be focused on buying or should I say accumulating a coin.
On a trading chart, an accumulation period for any asset is always followed by a move up in the price of the asset.
So, we can safely say that, an accumulation period in the market is a period that precedes a bull market.
When a coin or asset is accumulated to a point, the end result is for that asset to enter an uptrend on the charts.
Let's take this daily chart for the XRPUSDT pair as an example, we can easily identify an accumulation period between sometimes in March down to the end of July when the price starts to move up.
The area encircled by the green border can be considered an accumulation period.
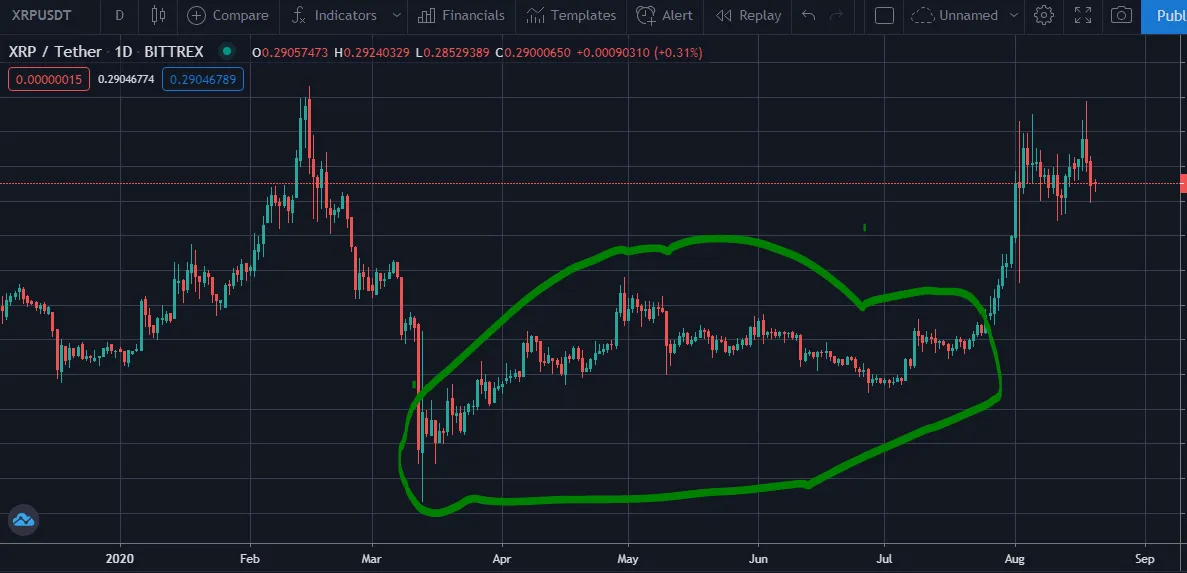
Truth is, if you deeply analyze the chart above on different timeframes you will find more accumulation and distribution moves within the period I highlighted as a period of accumulation.
But based on the timeframe I am using here and how much the market moved up in the end we can consider the entirety of that period as a period of accumulation.
Sideways movement of a chart
Now, there's an important thing I'd like you to keep in mind in terms of accumulation.
If you look at the chart below, you will find that there is an area enclosed in a green border just almost by the far left side of the chart.
A close look at the price movement during that period will tell you that the price was only moving within a certain price range for a certain period. For the sake of simplicity, let us call this a sideways movement phase.
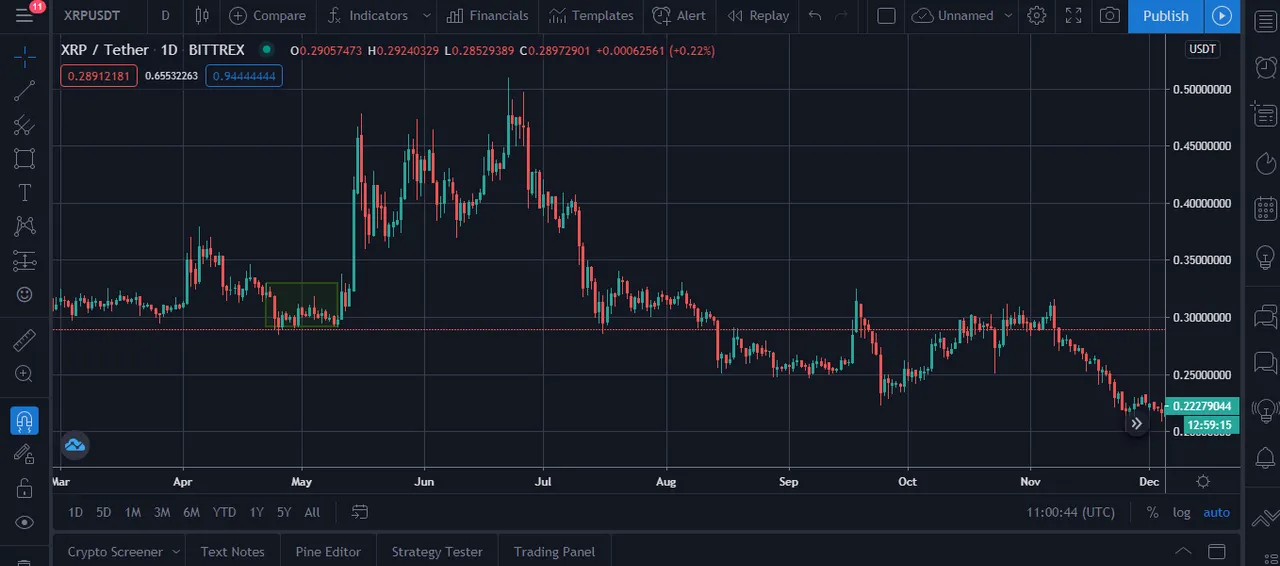
A lot of experienced traders would refer to a period like this as a phase where the market has not decided whether it wants to go up or down thereby cannot be accepted yet as a period of accumulation or distribution.
But, I personally feel that once the end result of a sideways move of an asset in the market is a move up of the price, then that period automatically becomes an accumulation phase.
A perfect example is the area/period on the chart in the image I shared above.
Accumulation Targets
All traders and investors tend to accumulate with a target in mind, a target as used in this context is a point on the price chart where either the investor is satisfied with the amount of profit they have made on a trade and they sell the asset to take profit(profit target), or the point where the investor cannot afford to take any more losses and they sell the asset to minimize the loss(stop-loss target).
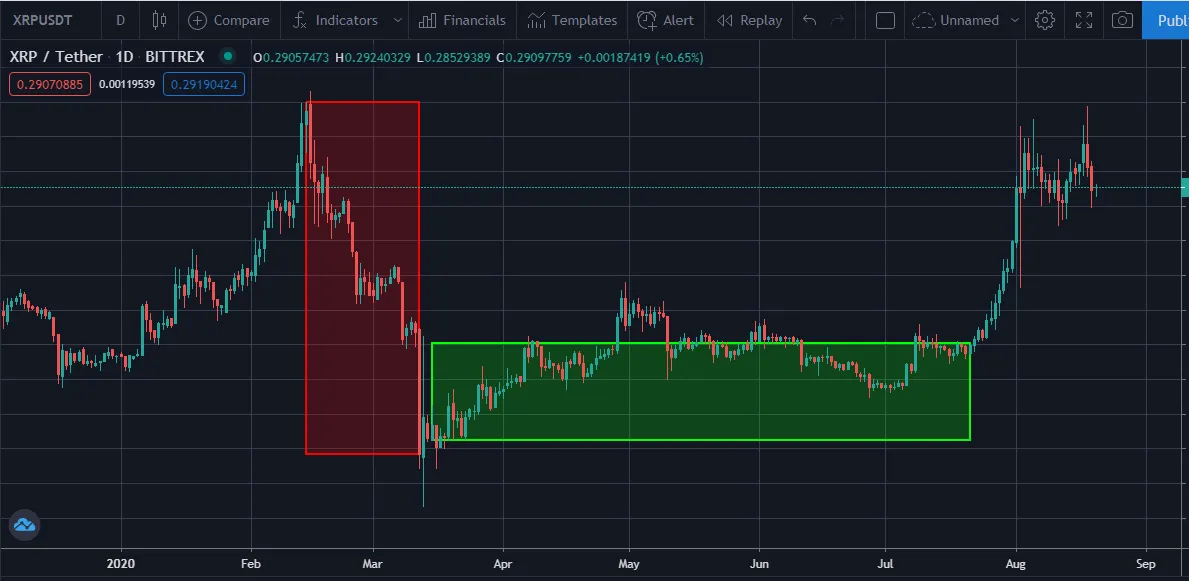
An example of a target is shown in the image below, the area enclosed by the red border can be considered as a profit target for the area of accumulation enclosed by the green border.
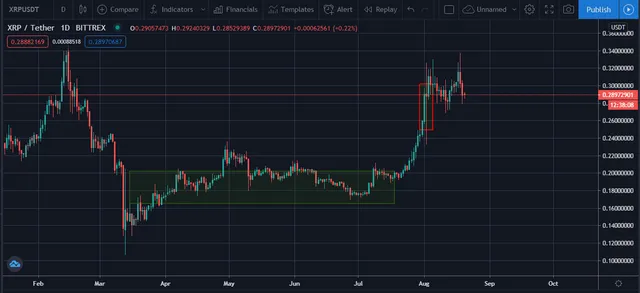
The reason for my conclusion above is because if we look closely at the area enclosed by the red border, we can see that there are some elements of distribution showing up around that point causing the price of the asset to move down.
A straight forward explanation for the move down in price when the asset price hits a target is that someone or people in the market who bought in during the period of accumulation decided to sell at that point thereby driving the price of the asset down.
Distribution
A distribution is an event or a series of events in the financial markets that involves traders and investors selling an asset in a bid to take profit.
A distribution period always follows an accumulation period as part of the market cycle.
Whenever an asset accumulates in the market and the price moves, it usually ends up distributing when the price has moved up to a target set by the majority of investors in the market.
A distribution period in the market always results in the price of the asset moving down and re-accumulating for the next accumulation-distribution cycle.
The chart in the image below shows us easily what a distribution period looks like on a chart.
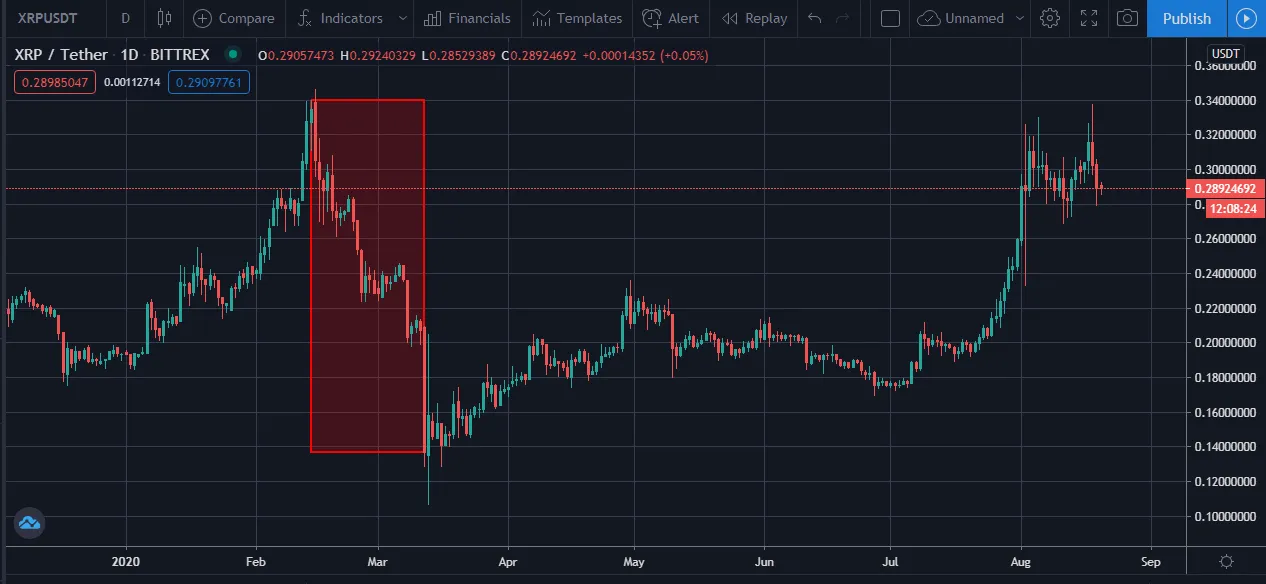
The are enclosed by the red border is a perfect example of a distribution period where the price of the asset is in a downward move because the accumulation of the asset has pushed its price to hit a target.
A distribution period is always followed directly by another period of accumulation, ensuring the continuity of the accumulation-distribution cycle.
If you check the image below, you will find that the distribution period shown on the chart is followed immediately by a period of accumulation where the price of the asset begins an upward movement after a certain amount of time in the accumulation period.
The area encircled in red on the chart is the distribution period while the area encircled in green on the chart is the accumulation period followed by a move up in the price of the asset.
Final note
The best time to enter any trade is during a period of accumulation where the price will end up moving up resulting in a profit for you as the investor.
However, the statement above begs a very important question, which is
How can one easily identify the period of accumulation on a price chart before it reveals itself and it is too late to buy?
The answer to the question above is not a definite one to be honest and it depends on a number of technical factors that might not be easily understood by someone who is new into investing and trading generally.
The trading strategy being used by a trader would be the one to help him decide whether a coin is in an accumulation period and if the time is right for him to take position.
Personally, for me, factors like the testing of support and resistance price levels being tested, respected or broken out of play a big role in helping me determine whether it is time to buy or sell.
That being said, understanding the theory of accumulation and distribution is very important for anyone looking to make a career out of trading and investing in assets in the financial markets.
Just like lots of like theories that governs the financial markets the theory of accumulation and distribution is applicable to all the available financial markets available.
If you need to better understand the anatomy of this theory you can take a look as the following sources as the certainly helped me in my research on this topic
Thanks for reading through
This post was brought to you Courtesy of the @instantchange Team. Be sure to visit our website (https://instantchange.online/) to quickly Swap Your Cryptocurrencies Anonymously and Securely!!!
You can click the link below here to read a brief guide on how to make an exchange within seconds on our platform.
https://bit.ly/How_to_Use_instantchange-Online
We currently offer exchange of up to 170 pairs of cryptocurrencies, giving you a wide range to pick from!
You can reach out to us or follow us on any of our social media handles! We'd be happy to have you with us!

 Twitter

 Email
Email
