Happy day, beautiful people!


From HIVE I started to send my coins to the exchange Huobi.com to make some moves. My idea is basically to buy when the price is low and sell when the price is high.
It sounds simple, but in a short time I learned that it is not easy to know what value can be considered high and what would be the low. At least not without knowledge. It happened to me that I bought hives when they were above 0.35, when they started to fall with no return, and then sold them below the price. It was my hazing payment, obviously the return spread was not high. I knew I had to start small. I also had some hits with other cryptosystems that I'm following up on, so far I'm only checking their behavior by year, month and day to see how they vary. I like the ones that show a cyclical up and down behavior, with significant percentages. Those that are linear over time are not attractive to me, at least for short term movements. I have also noticed that some crypts increase their value drastically, even when all the others fall. I don't understand any of this yet. I suppose each one will depend on the project behind it.
The prices of the crypt coins I acquired in my last few moves, including the hive, fell. According to what I read, due to the global scenario with the stock market and the pandemic, among other factors; however, I hope that soon the market will turn around and prices will rise again, which is what I have seen happening over time.

Everything I have done and analyzed so far has been on the basis of observation only. But from the beginning I've been uneasy about everything I don't know. I believe that the world of the cryptomarket or trading is a science and requires a lot of study.
From my ignorance, I feel that the first thing I should know is to read a candlestick chart, because it is the first thing you see when you enter an exchange and it summarizes a lot of information that can be useful, when you don't have anything else.
On the web I found a publication Introducción a la interpretación de gráficos de velas (Introduction to the interpretation of candlestick charts), which contains some basic concepts and general ideas that were useful for me to understand them a little; for example, that in those charts the period refers to the "general drawing" that reflects "the evolution of a security" in the time frame that we have previously "chosen". On the other hand, the interval or frequencies are each one of those "units" that form the "sequence of the global evolution" and that, when we see "in an isolated way", "they describe the summarized evolution of the value in that specific interval". In turn, that unit is called: Candle, Japanese candle or "Candlestick".
I don't want to go into too much detail, but I think it's important to mention here that these candles are formed by a body and 2 wicks, the body gives us the price variation in that interval, which starts to form with the opening price and ends with the closing price. The upper wick gives us the maximum price found and the lower wick, the minimum.
If we choose in our candlestick chart, a period of 15 minutes, each candle will start after 15 minutes of market. And finally I will mention that, at least for the crypto market, if the candle is red, it is because the closing price is lower than the opening price, while when it is green, it tells us that the closing price is higher than the opening price.
There is a lot of information on the web about this type of charts, I even saw that certain behaviors are identified and described. I find all the information they can provide interesting and I will continue reading about them; however, with this brief information that I share, I feel a little located when I see the exchange's graphs.
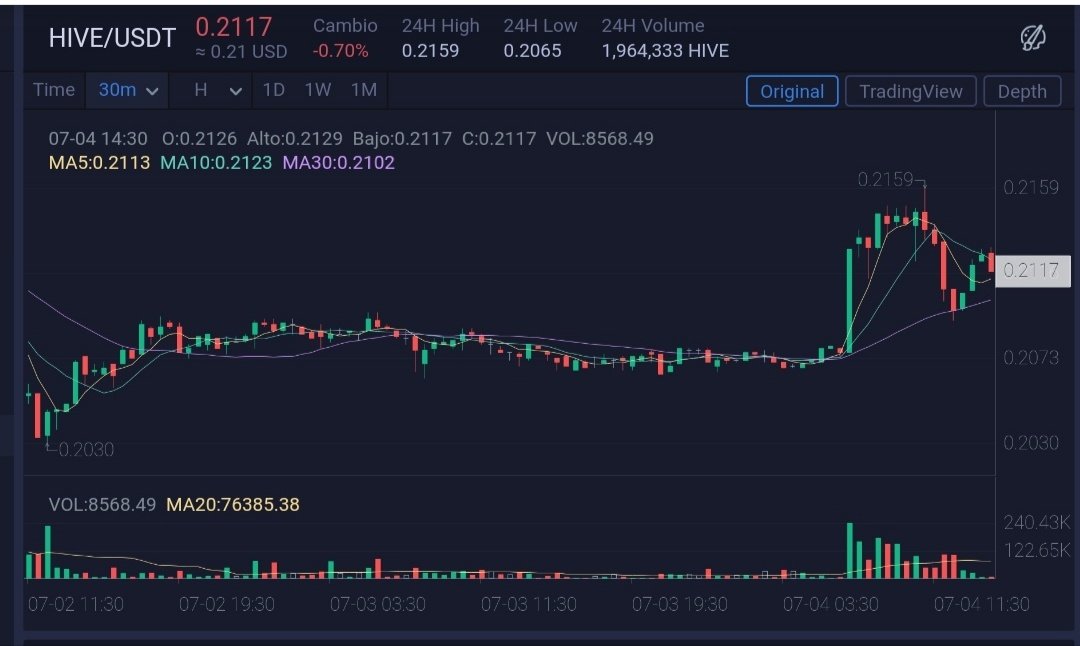
Fuente imagen Date: July 4, 2020, 2:55 PM

That's all for now my dear readers, we keep in touch on this path of learning.
Customized emoticons with the Bitmoji app downloaded from the Play Store for Android.
Translation courtesy of deepl.com