Identifying the support and the resistance level of a crypto asset on a chart can make a spot trader bag some profits many times daily. We all know how dynamic the market is. It goes up and down every time. That's why it's difficult to speculate the price of an asset. Initially, I thought the only way to mark support and resistance level is through drawing a horizontal line. Many of us can easily figure that out in the market, but the thing is that there are other ways to figure out when a crypto asset hits the support and resistance levels. These may not be visible to us because our mind always draws the horizontal line to detect these two levels. The dynamic support and resistance level of an asset can be monitored using EMA (Exponential Moving Average)
EMA is an indicator that measures the trend or the direction of an asset over a specified period of time and it shows the support and resistance level of an asset on a crypto chart. This does not work like the horizontal lines drawn to know whether a resistance and support level is reached.
How does EMA act as support
Firstly, let's take a look at the image below. What can we see?
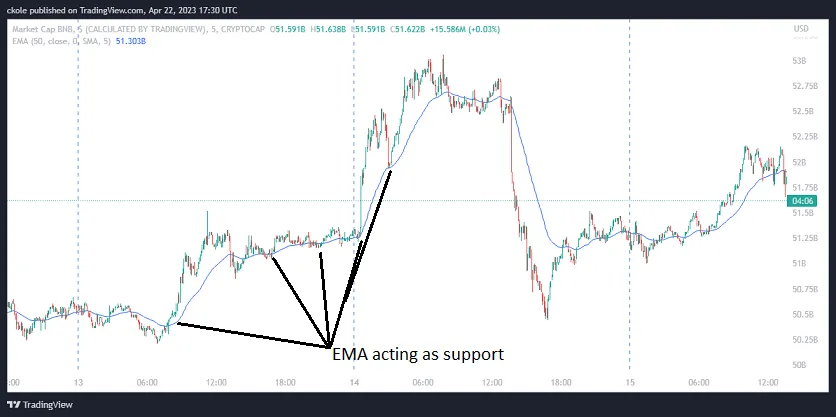
From the above image, we can see the lines from different points. Those are the levels where the EMA acts as the support for the price of the asset. At that level, the Exponential Moving Average pushes the price back up, disallowing it to break the EMA line. Each time we see a rebound in price from the EMA, it's supporting the price at that point in time
EMA acting as resistance
Let's see the the image below
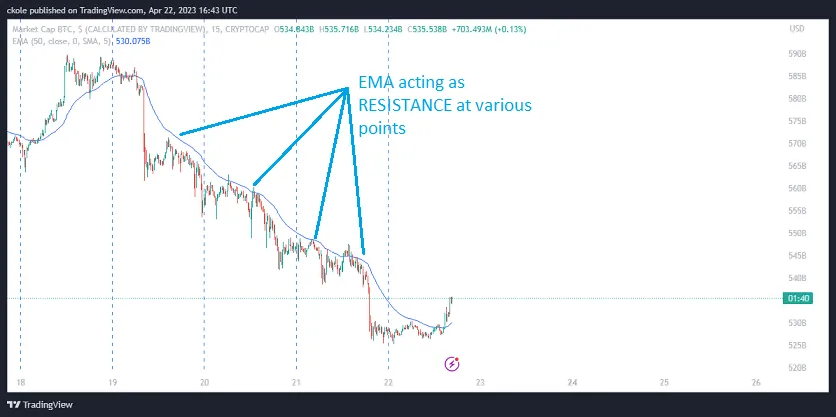
From the image above, the EMA is acting as a support. Each time the price hits the EMA, it pushes it back downward. It acts as a resistance level for the price of the asset thereby becoming difficult for the price to break the point
Using double EMA to find an entry and exit point
We can use double EMA on a chart to analyze the market and find our entry and exit point . Here, I will set the length of the EMA as 50 and 100, giving them blue and red color. The two Exponential Moving Averages can help us to better see the market trend. The two EMA's are visible on the chart. The length of the red is set to 100 while the blue is set to 50. Why it's good to use a double EMA is because it makes it more easier to spot the resistance and support level
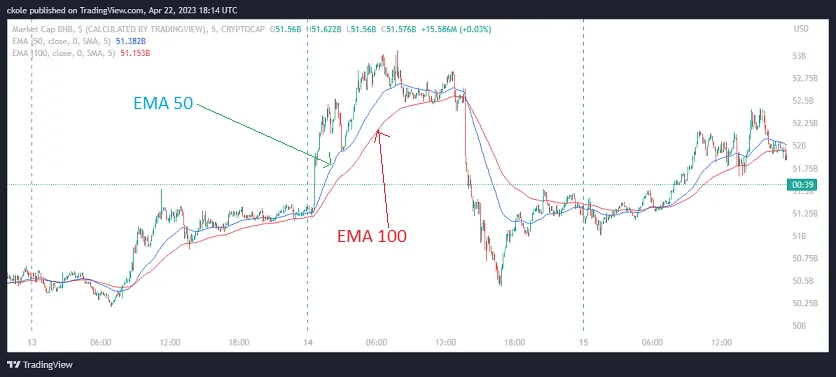
Apart from that, when the EMA 50 crosses the EMA 100 to the top, a bullish movement is signified. You can see that the price is always moving up when the blue line is above the red line. Also, when the EMA 50 (blue line) is below the red line, it signifies a downward movement. This can help to spot and follow the market trend
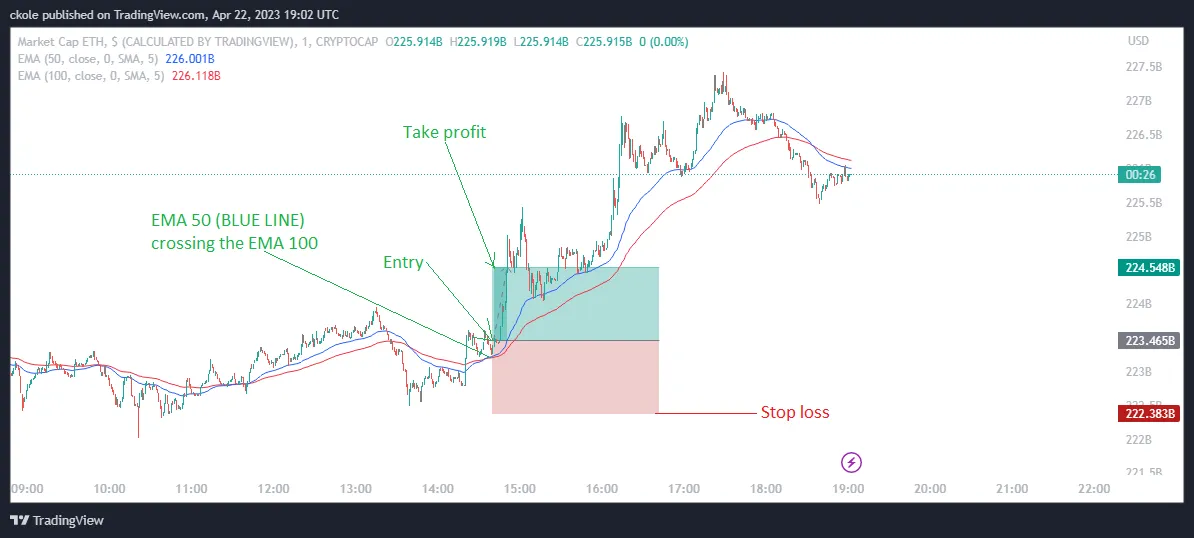
Entry point
Looking closely at the chart above, the best entry point is after the EMA 50 crosses the EMA 100 and bullish candlesticks are built. The market is seen respecting the EMA that serves as the support and we can clearly see that the gap between the tw EMA's are wide enough meaning there's probability of more bullish movement. Sometimes, the price of an asset may or may not touch the lines before it reverses, and also, sometimes it touches the line and pierce it. So i \n this wise, it's important to patient to allow the price to touch the line and create a reversal before placing a buy order or entering the market
Whether we are buying or selling, we must ensure that the price of the asset is above the two EMA's (50 and 100) when we are buying, and when we are selling, it must be below before we place an order
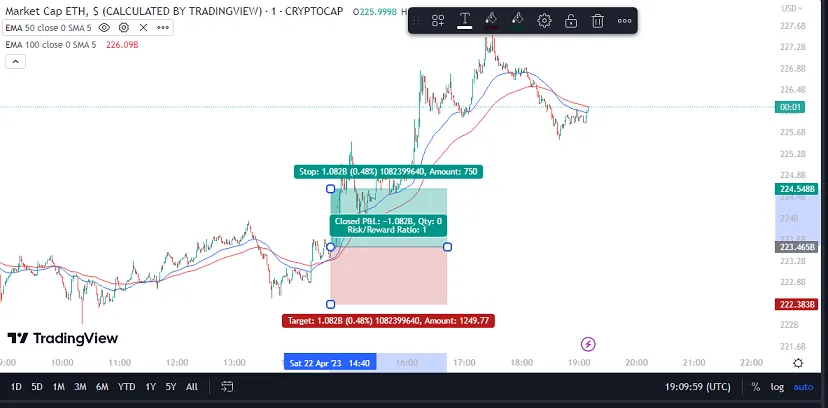
Setting take profit and stop loss is important if you are using the EMA indicator to trade spot using a short time frame. Using a 1:1 ratio is also a good idea when the market is carefully followed using the two EMA's, and we must ensure to take profit when the asset price reaches the profit target and keep an eyes on another potential entry point
Conclusion
I shouldn't forget to add that an EMA is not suitable in a ranging market. When the market is ranging, there is no point trading any pair. Just wait till the market is set.
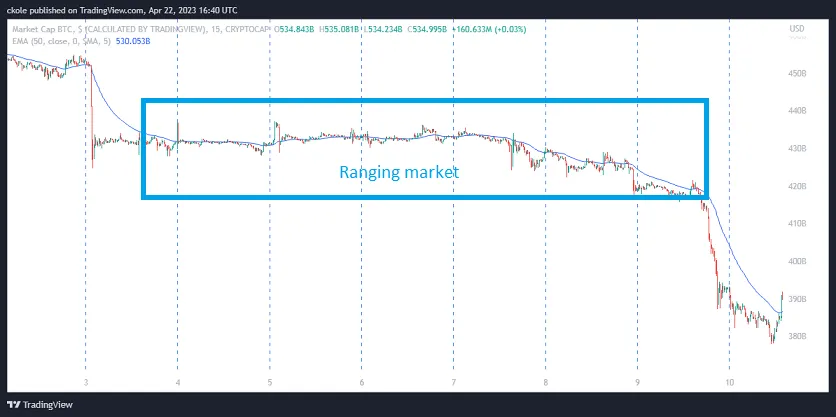
The exponential moving average is a useful tool that can be used to spot the resistance and support level of an asset. It can help to reveal the price movement by understanding the market trend. We should always learn to trade with the direction of the trend and desist from entering the market when the market is ranging. On every chart, higher high and higher low appears a lot. We can utilize that using the EMA's. We can practice this before going into real trading on tradingview
Thanks for reading
This is ckole the laughing gas
One love
All images in this post are screenshot from my singleview account coupled with a little design using paint. They are my properties and anyone is free to use them as they deem fit with or without my consent.
Disclaimer: This info is based on my personal knowledge of indicator. All indicators are not 100% perfect, so the experience of the trader matters in using indicators for trading. So please, trade wisely using any form of indicator