Hey everyone and welcome back to the third tutorial in our ggplot tutorial series. In today’s post, we continue exploring how to customize plots in ggplot by using the theme() and element_text()commands. Some of the things we will cover in this post include
Let’s get started!
For the purposes of this tutorial, I'm going to assume that you've already created a basic plot with a few labels. If you're unsure of how to do this, feel free to check previous tutorials where we go over creating a basic plot in complete detail.
library(tidyverse)
library(palmerpenguins)
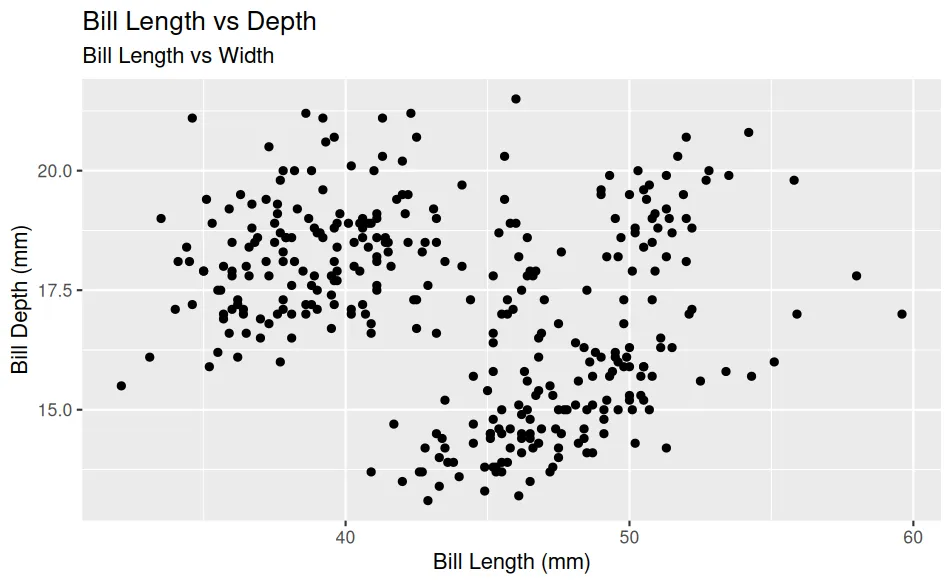
ggplot(data = penguins,
mapping = aes(x = bill_length_mm, y = bill_depth_mm))+
geom_point()+
labs(
title = "Bill Length vs Depth",
subtitle = "Bill Length vs Width",
x = "Bill Length (mm)",
y = "Bill Depth (mm)")
Adjusting Elements
Perfect! Now that we have the basic plot, we can move on to customizing things. I'm going to show you a simple example and then I'll explain what's going on in more detail. To start customizing things, we need to add an additional geometry which is the theme.
ggplot(data = penguins,
mapping = aes(x = bill_length_mm, y = bill_depth_mm))+
geom_point()+
labs(
title = "Bill Length vs Depth",
subtitle = "Bill Length vs Width",
x = "Bill Length (mm)",
y = "Bill Depth (mm)")+
theme(
plot.title = element_text(colour = "purple", size = 15),
plot.subtitle = element_text(color = "green")
)
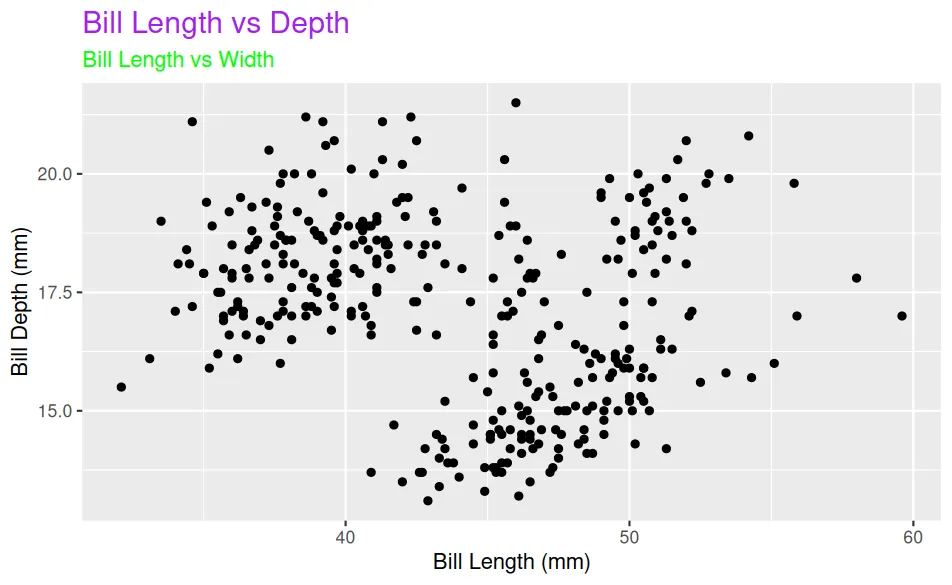
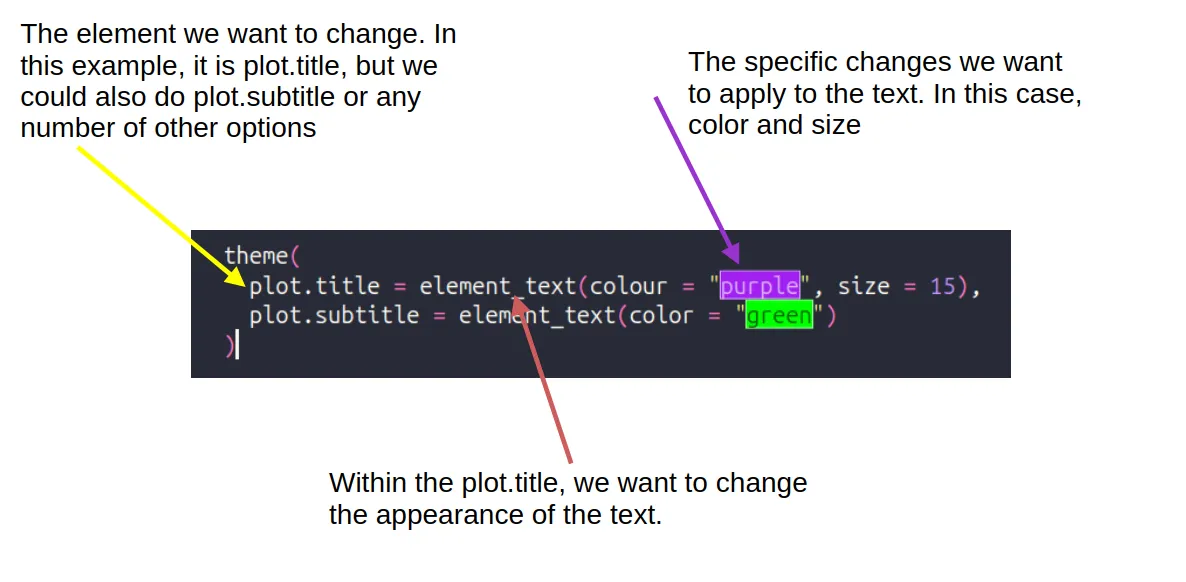
Notice that the only thing that has changed between this code and the previous code block is the addition of the theme element. Changing the aesthetics of plot elements using the theme command is a three-step process. We have to tell ggplot the specific item that we want to change. We have to tell it what aspect of that item to change, and then we have to tell it the specific changes we want to make. I’ve done my best to explain this in the following graphic.
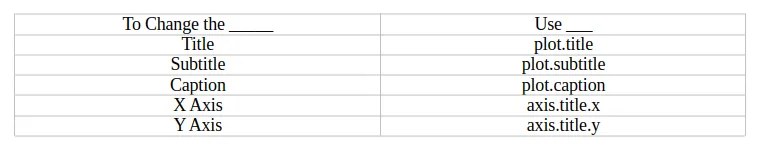
Things We Can Change
The cool thing about ggplot is that changing the text on the subtitle follows the same process as changing the text on the title. We follow the same process and just swap out the elements we want to change. The official documentation lists 163 different chart items we can change, but some of the more common ones are listed below.
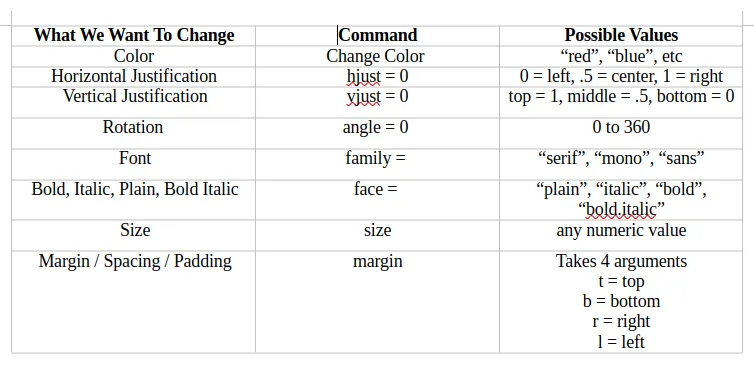
Likewise, the element_text command allows us to make many different changes. Some of the more common ones are listed below.
Summary
It can be a little bit difficult to explain all of this via text, so recommend checking out the attached video for a more detailed analysis. That being said, I hope you found this post useful, and I appreciate you taking the time to read it.