Two of my favorite things are finance and the R programming language, and in today's post, I wanted to provide a beginner's introduction to the tidyquant package, which merges both of these interests. We will discuss what tidyquant is, how to install it, and some of the functionality it offers.
Getting Started: What is Tidyquant?
Tidyquant is a financial analysis package for the R programming language that allows you to import, manipulate, analyze, and plot financial data (Dancho & Vaughan, 2025). The package is completely open-source and available for free. As the embedded video shows, tidyquant can be installed and pulled into your R workspace with two simple commands.
install.packages("tidyquant")
library(tidyquant)
So, What Can It Do?
Tidyquant has a plethora of useful functions, and describing each of them in detail would require several articles. However, there are a few that I find especially useful. One of the most useful features is the tq_get command. This command allows you to pull in data for one or multiple stocks without having to navigate to a third-party site, download the data into a CSV, and then import the data into R. The basic syntax looks like this.
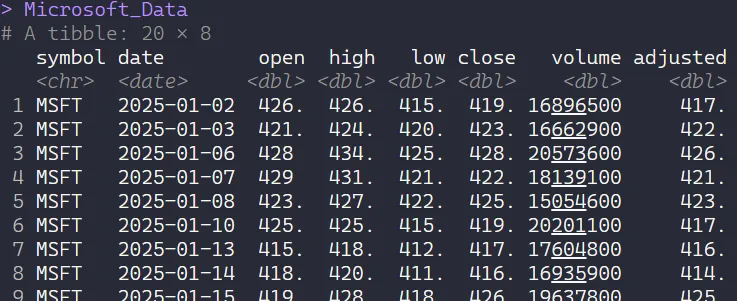
Microsoft_Data <- tq_get("MSFT",
from = "2020-01-01",
to = "2025-01-01")
Notice that the first argument we pass into the function is the ticker symbol in parentheses. We then enter the from and to dates for which we want to collect pricing data by using the yyyy-mm-dd format. R will then collect the data and create a data frame that contains the DATE, the OPEN, the HIGH, the LOW, the CLOSE, the VOLUME, and the ADJUSTED price for the stock.
We can pull multiple stock prices at once by modifying the command like this.
Multiple_Stocks <- tq_get(c("MSFT","T","AMZN"),
from = "2020-01-01",
to = "2025-01-01")
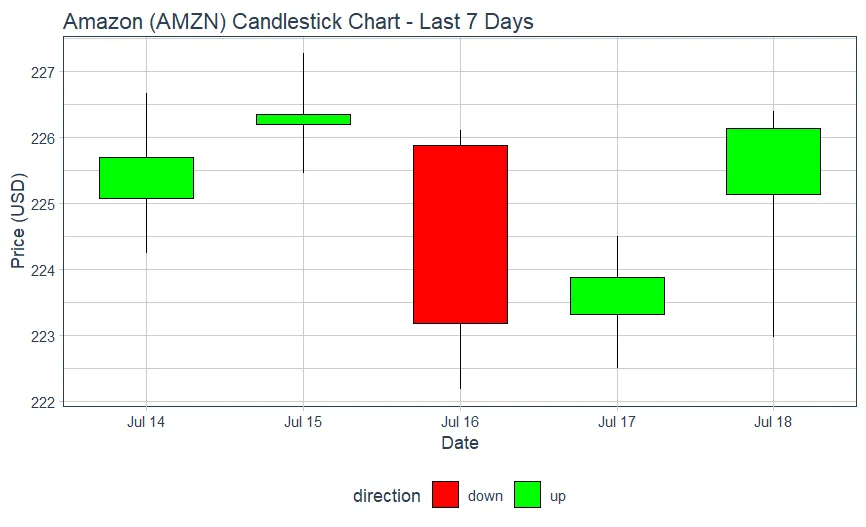
As the video explains, this is just scratching the surface of some of the amazing features that the Tidyquant package offers. We can also pull other types of financial data, such as inflation data from the Federal Reserve, or we can pull cryptocurrency data by using the tiingo.crypto API. Beyond simply pulling data, tidyquant offers a number of powerful analysis and visualization tools, such as candlestick charts, that are well worth checking out if you like doing financial analysis but don't want to pay for a third-party service.
Thanks for reading!
References
Dancho, M., & Vaughan, D. (2025, February 13). Tidyquant: Tidy quantitative financial analysis. https://cran.r-project.org/web/packages/tidyquant/index.html