Here is the hive chart and analysis about the possible price movement in this altseason. Many hive users are interested to see any analysis regarding hive coin and they want to know whether #HIVE have the potential to reach its all time high.
Hive is a crypto coin which is being supported by its ecosystem, the more ecosystem will expand the higher the price will go. It all depends upon its ecosystem and the development that comes.
We all know that Bitcoin is continuously making all time high while majority of the altcoins are lagging and even some are still at its all time low. If I talk about HIVE, its totally lagging and the price is stuck at its downtrend position.
But these coins have to perform early or lately, the main reason is that the money flow is soon going to shift from Bitcoin to other altcoins. Which is also known as altcoin season.
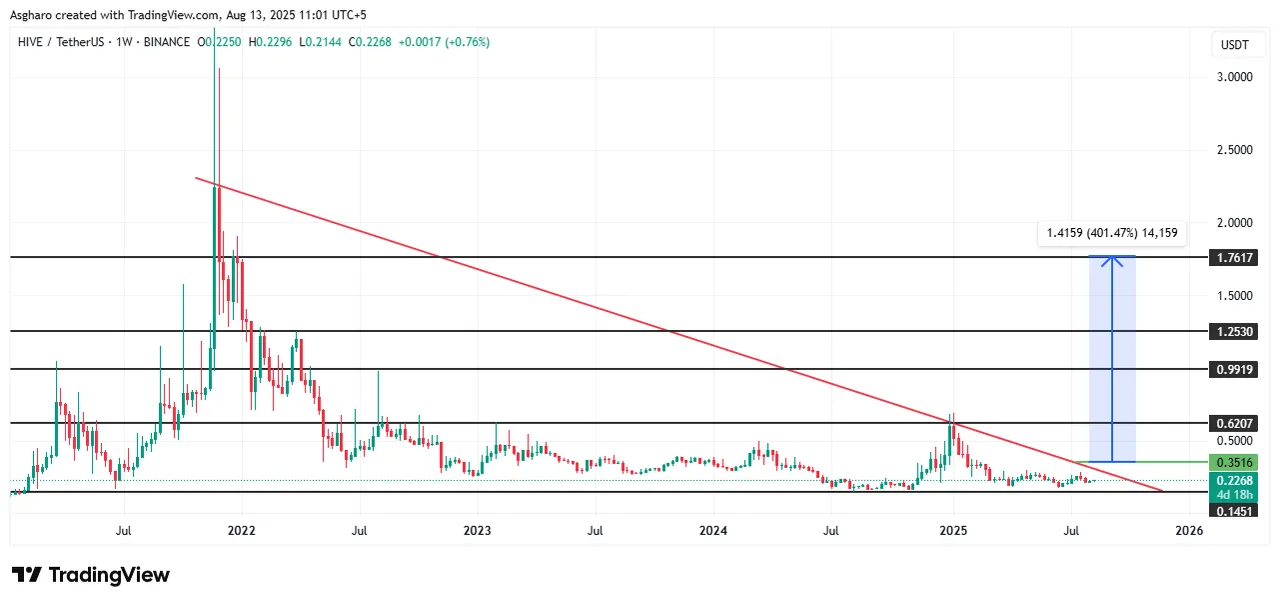
I have two graph in this post to explain hive. This is my analysis and I am hopeful it will come true. In the first image you will see I have opened 1W chart and its in bearish trend.
According to the trendline, HIVE will be bullish it the price stays above $0.35. This is the price zone which changes the trend towards bullish. Hive needs some good volume to break that level in order to change its bias.
I will not consider hive bullish, until it breaks the level of $0.35. Once we see a good breakout then surely the bull run for hive will start. Hive is not like other coins to take time for to reach its higher level prices.
But its a kind of coin which only takes some weeks to reach its all time high. That is why it is very must to understand the crucial price levels of HIVE.
All those who have hive holding, they must wait for the price of $0.35. After that they can start selling at different levels as I mentioned. There are 4 different levels for hive to sell and these are the better ones.
According to me, there is very less chance for HIVE to reach its all time high but there is 70% possibility to reach $1.75. Its better to keep on selling at different levels so that to not miss the opportunity.
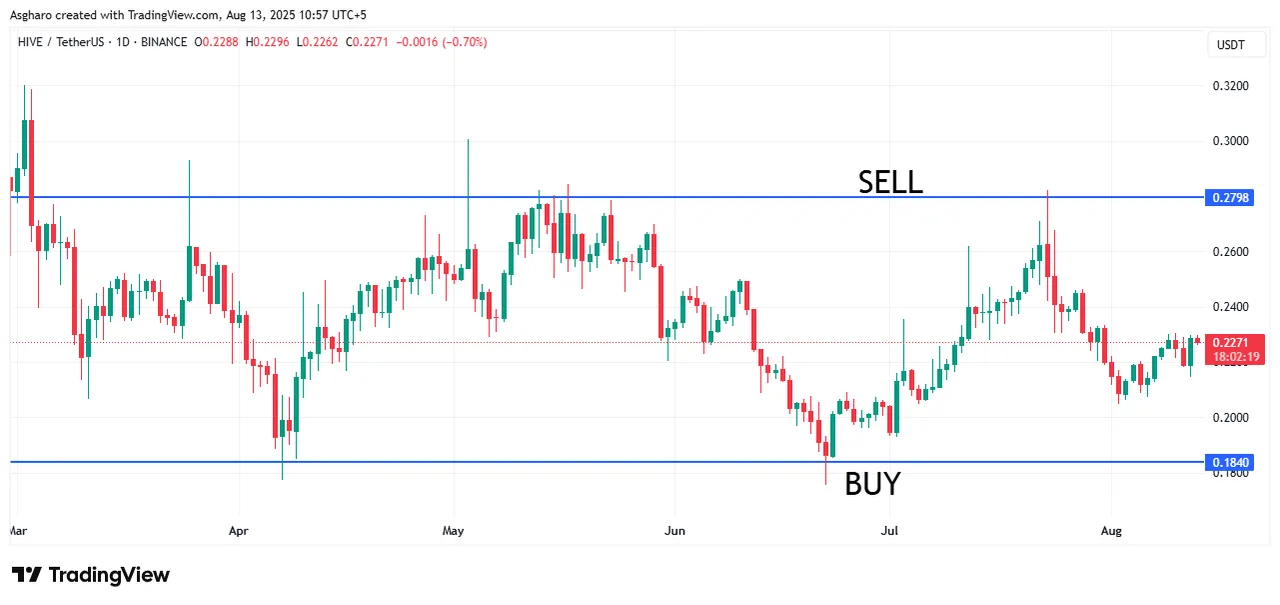
According to the second chart which is 1D time frame. The price is range bound between $0.18-$0.28. This is the safe zone for the traders. But at the support level and sell at resistance as I marked. I hope the post will be informative...
I hope you find this post interesting and I hope you enjoy it. If you like the post, please leave feedback in the comments section so that the next one will be even better. Thank you for sticking with me until the end.

TWITTER TELEGRAM HIVE WHATSAPP DISCORD
REMEMBER: We should prepare for the unexpected and hope for the best. Life may not be easy, but you must do your best and leave the rest to God.