I covered an analysis on Hive about a week back. Even though the last breakout on 1Hour timeframe failed, it did create another interesting setup/pattern! So here's a trade opportunity you may look out for. :)
I will be charting HIVE/BTC pair for today.
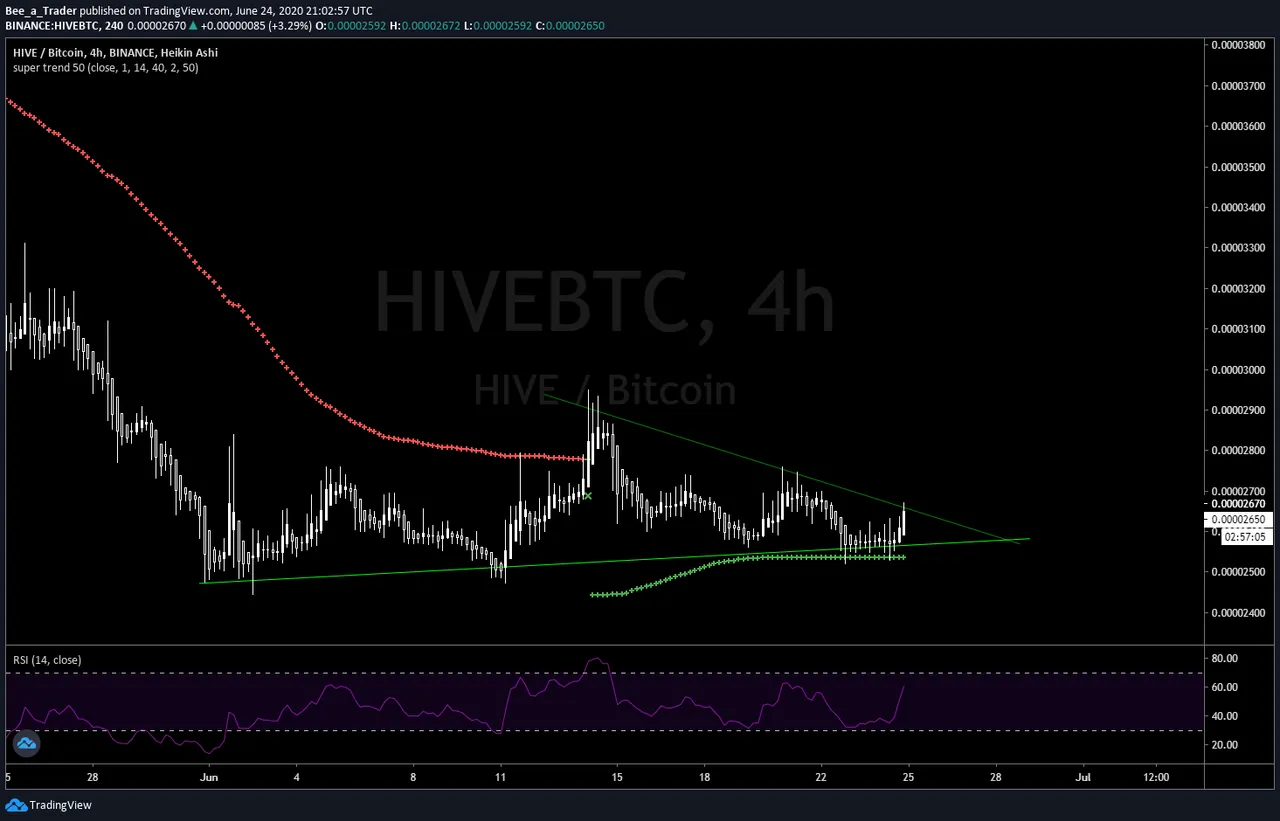
HIVE/BTC 4H
Chart 1:
Link: https://www.tradingview.com/x/gHFYUZNw/
Overall Bias: Neutral/Bullish
Points to note:
- Symmetric triangle pattern observed
- Super Trend Indicator is also bullish (Not any buy signal though, and it should not be used without other indicators as it may give false positives. So I'm not depending on it solely.)
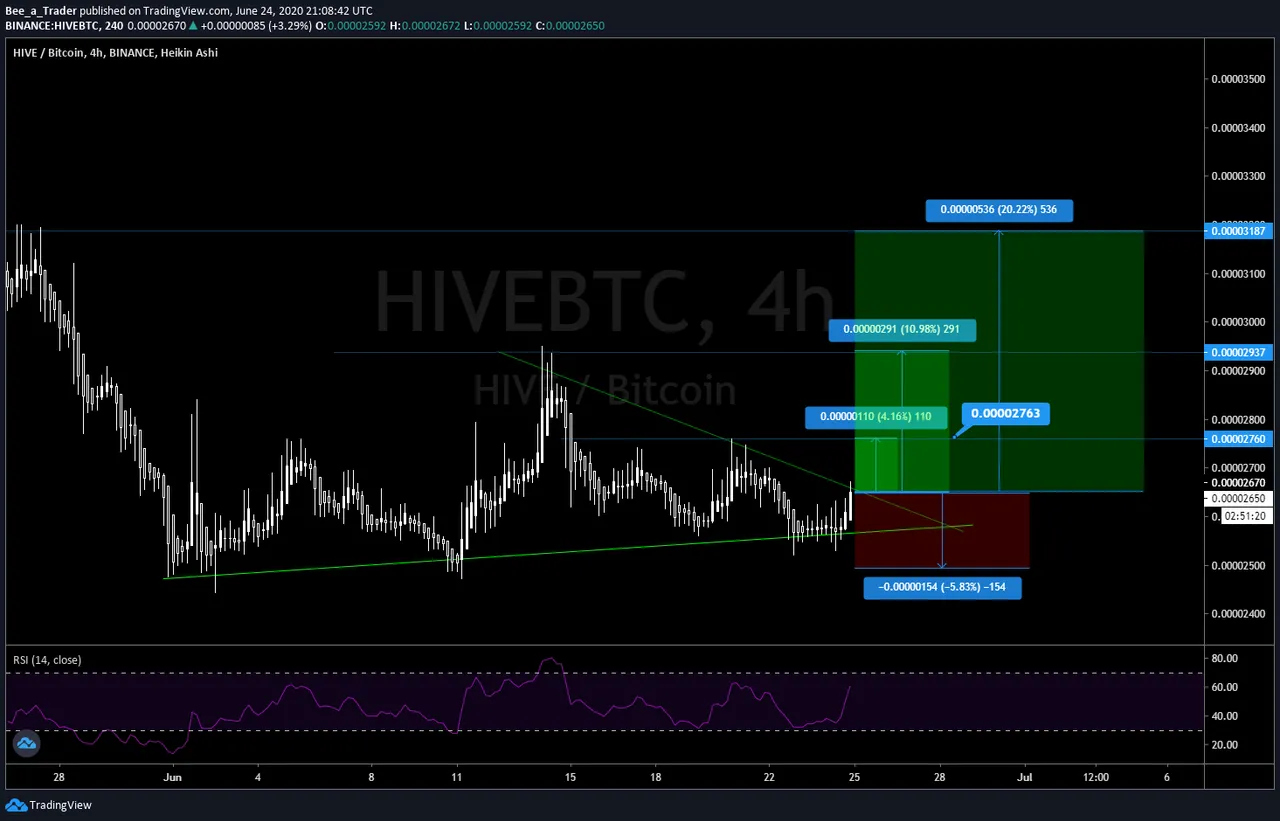
Chart 2:
Link: https://www.tradingview.com/x/mV1ICCcG/
If you are long on Hive, check out the R:R on breakout (based on simple supports and resistances).
Critical zones have been marked on chart!
- Dips are for buying :D
But wait, there is one interesting point to note:
Check out Steem as well! It is showing similar structure, a narrowing trading range as shown in the chart below:
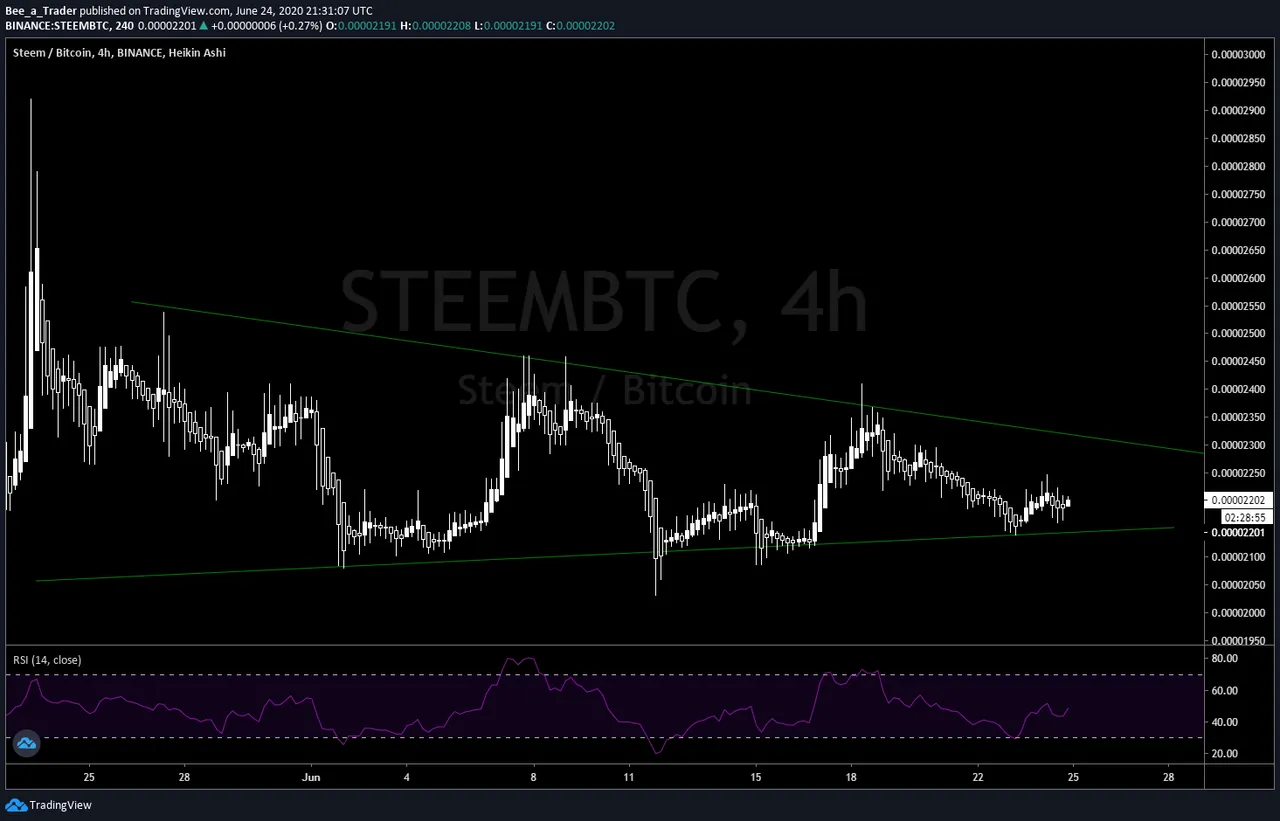
Link: https://www.tradingview.com/x/wFiWAfuz/
So which one will break out first? :P
Lets see!
I'm personally more positive on Hive for long term (won't matter even if it fails this small breakout as well)