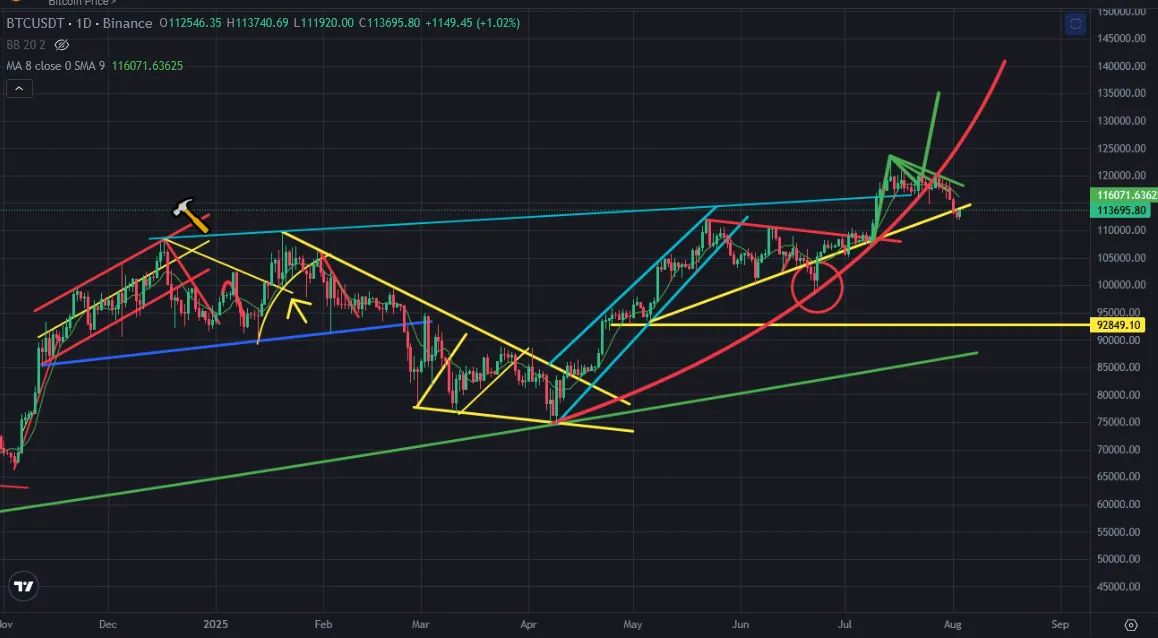
There was curve support line on Bitcoin price chart. Bitcoin broke down this curve support line. It is trying to stay above mini uptrend line.
Here you can see daily chart of Bitcoin price. After breaking down curve support line, Bitcoin price tried to reverse up but it retested this curve line and resisted. After completing resistance, Bitcoin price went down fast. But there was mini uptrend line on Bitcoin price chart. It is trying to support Bitcoin price. If it can not, we will see another price dump on Bitcoin price chart.
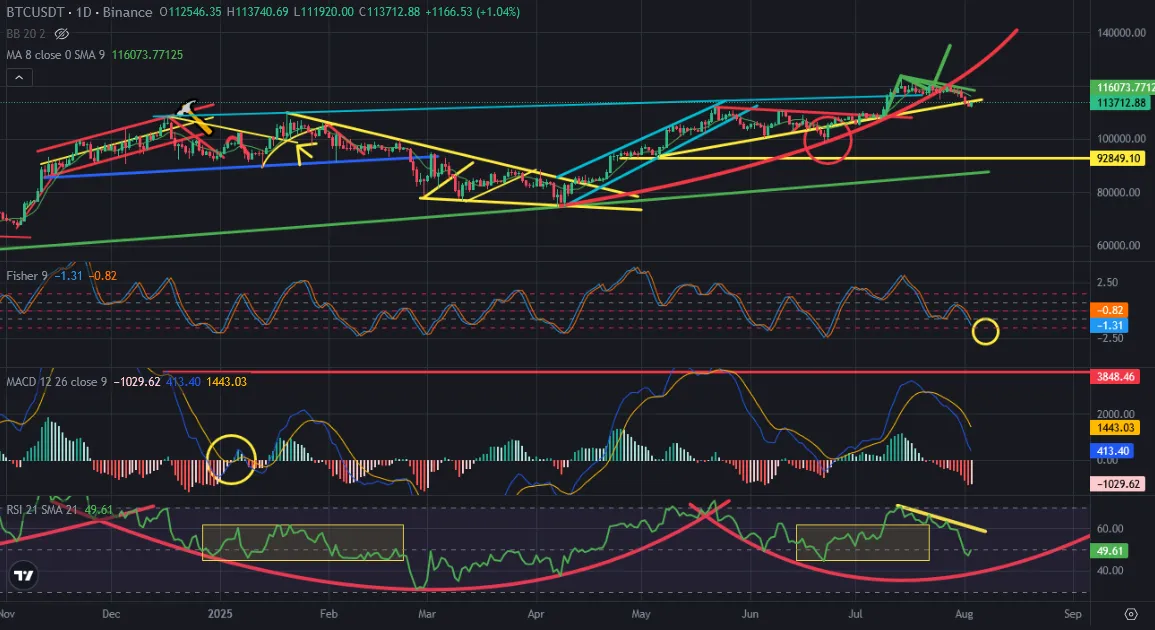
Here you can see the indicators on daily chart of Bitcoin price. MACD Indicator was on correction. It is trying to complete correction. Fisher Indicator is going down. It is close to bottom. We may see reversing up on Fisher Indicator. RSI Indicator is under resistance by downtrend line.
So, Bitcoin price may enter bullish trend again in this month. It should complete corrections. Most of indicators are at high level. We should see correction on this indicators.
It may be great time to pick up discounted crypto before bullish season of this year. I am waiting bullish season at the end of this year.
We will see..