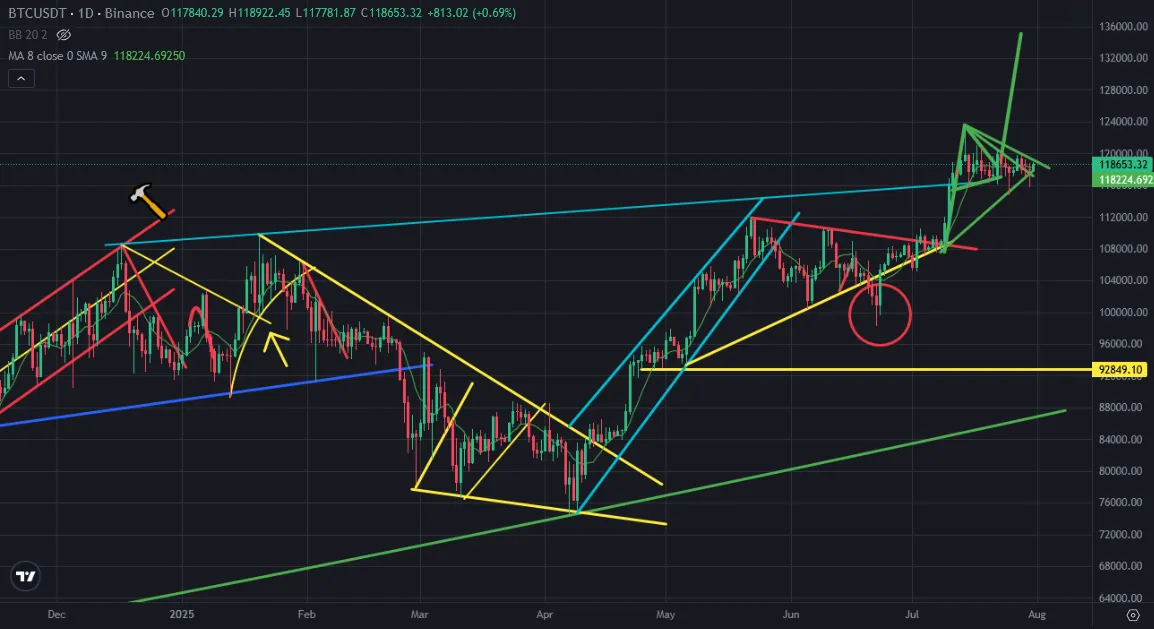
Bitcoin price met with 3rd mini downtrend line coming from all time high. Even Bitcoin price is broke up mini downtrend lines, it met with the new ones. There was bullish flag pattern on Bitcoin price chart. Bitcoin should break up these mini downtrend line to reach the target of bullish flag pattern.
Here you can see dailt chart of Bitcoin. There is also great support line on Bitcoin price chart coming from all time high levels. After major new dropped on market yesterday, Bitcoin will get high volatility.
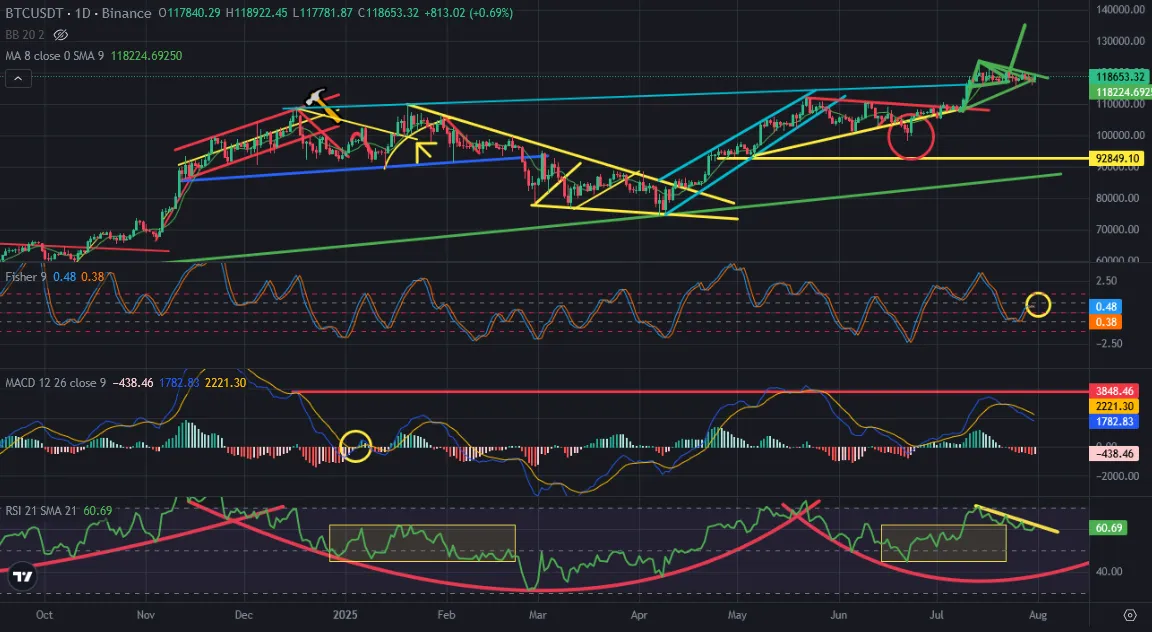
Here you can see the indicators on daily chart of Bitcoin price. Fisher Indicator can not seem as stable. It may reverse down if Bitcoin price gets red daily candle. MACD Indicator is still in correction. There is also downtrend line on RSI Indicator. It is getting stronger. Bitcoin may retest to break up downtrend line of RSI Indicator for 3rd times.
So, we should follow RSI Indicator. It may be hard to break up this downtrend line.
I shared a few analysis and said I was waiting price dump on crypto market at the of July. We can see this market dump on most of altcoins but major cryptos did not go down.
They are still solid and tying to continue to go up.
We will see..