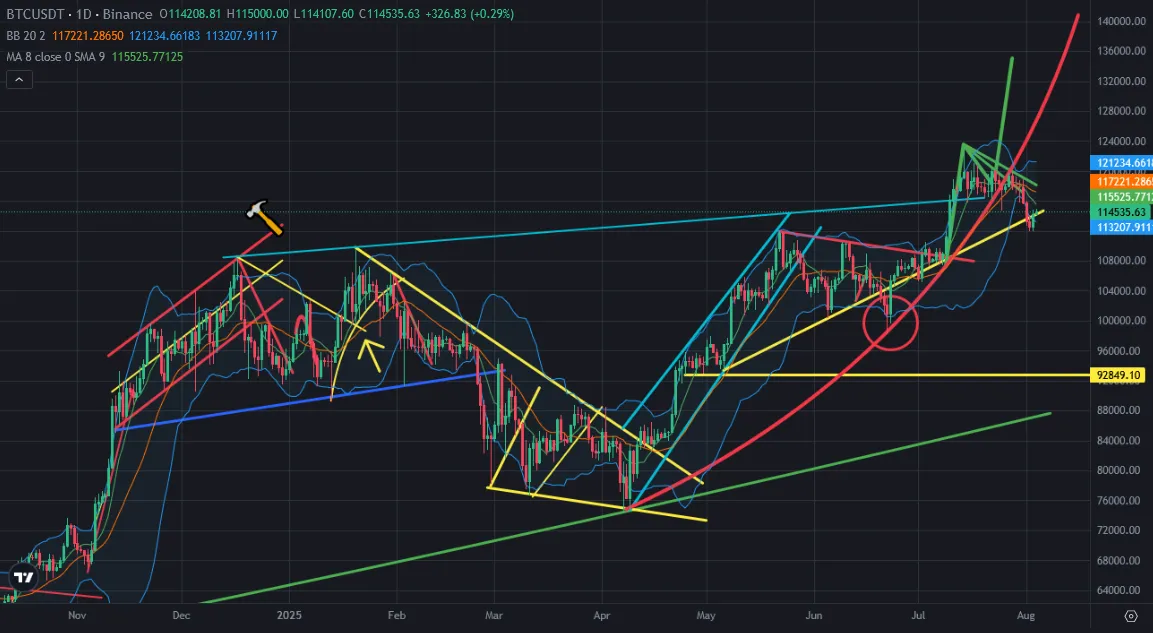
After getting 5 daily red candles, Bitcoin price is trying to reverse up with green daily candles. After price correction on Bitcoin price chart, it touched the bottom line of Bollinger Bands. Bitcoin price is trying to reverse up but It may be early.
Here you can see daily chart of Bitcoin price. There is mini uptrend line on Bitcoin price chart. Even it broken down, Bitcoin price is trying to stay above this mini uptrend line. If it stays, breaking down of this mini uptrend line will be a bearish trap for investors.
You can see what happened after touching the bottom line of Bollinger Bands in daiyl chart. The middle line of Bollinger Bands will be great resistance for Bitcoin price. It is at 117K USD level. We may see this resistance if Bitcoin price touches there.
Here you can see the indicators on daily chart of Bitcoin price. Fisher Indicator is on the bottom and close to revese up. If we see more daily green candles, we will see reversing up on Fisher Indicator. There is also downtrend line on RSI Indicator. Bitcoin price will be under resistance by this great resistance. MACD Indicator should complete correction during being under the resistance on RSI Indicator.
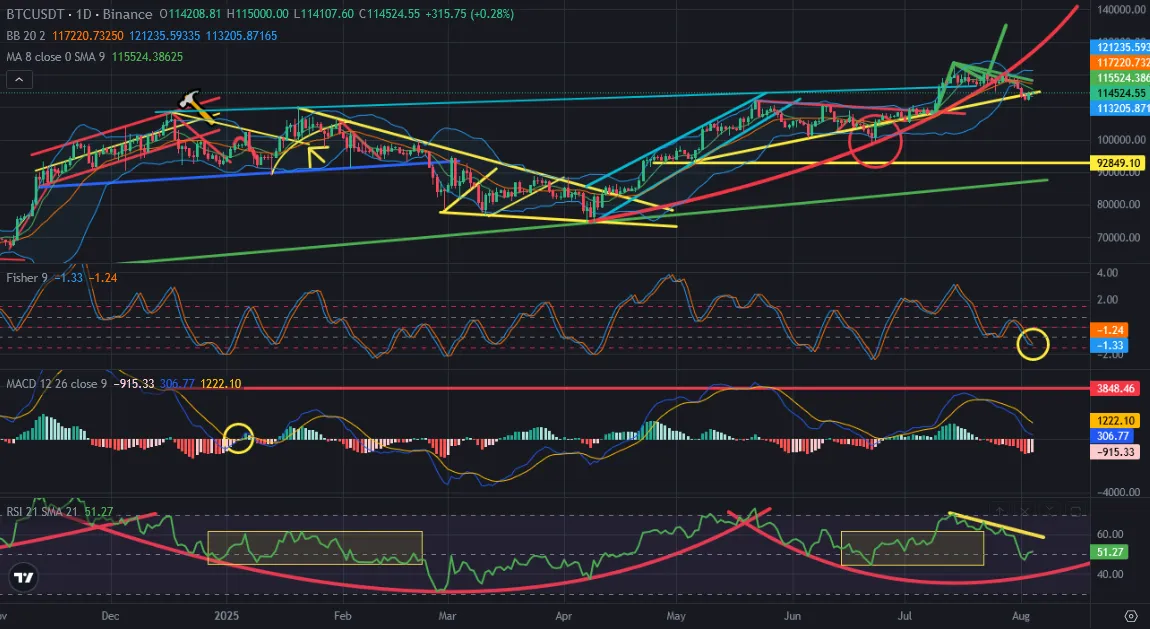
We may see bounce on Bitcoin price chart. After this bounce, Bitcoin price may meet with the middle line of Bollinger Bands. We may see abouther dump move on Bitcoin price chart after resisted by the middle line of Bollinger Bands.
We will see..