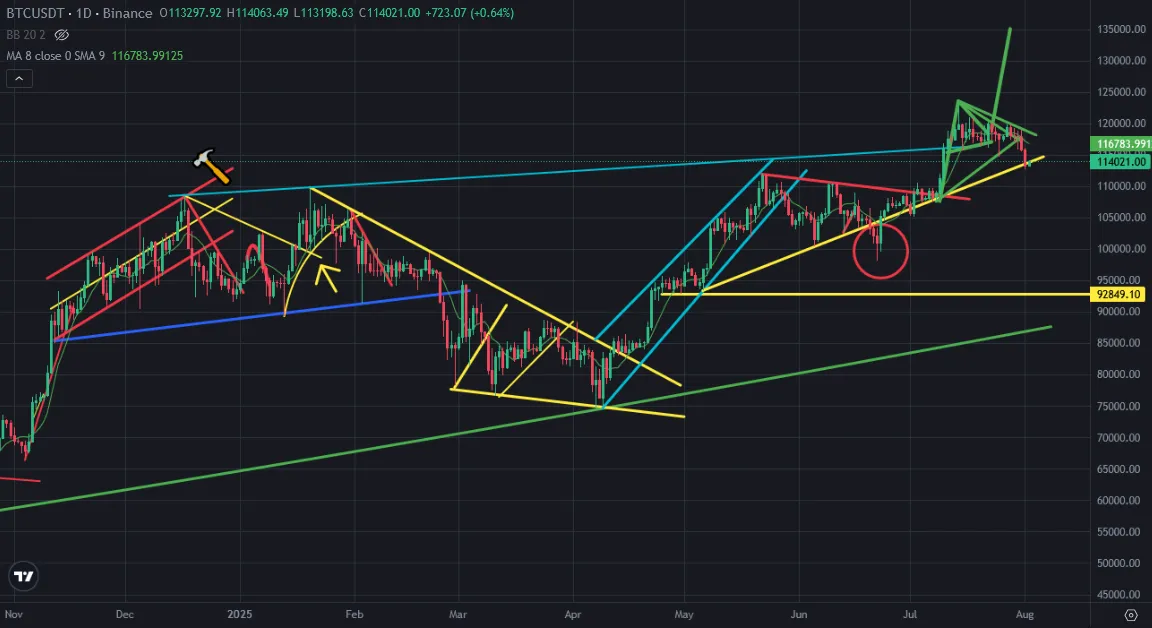
There was price correction on Bitcoin price chart. I shared a few analysis and said I was waiting price correction on Bitcoin price chart at the end of July. It happened. After touching all time high, Bitcoin price entered price correction. Bitcoin broke down great suppoer line yesterday. There mini untrend line on Bitcoin price and it supported the price.
Here you can see daily chart of Bitcoin price. After touching mini uptrend line, Bitcoin price stopped to go down. We may see waiting on this mini uptrend line. We may see huge volatility if Bitcoin price breaks down this mini uptrend line.
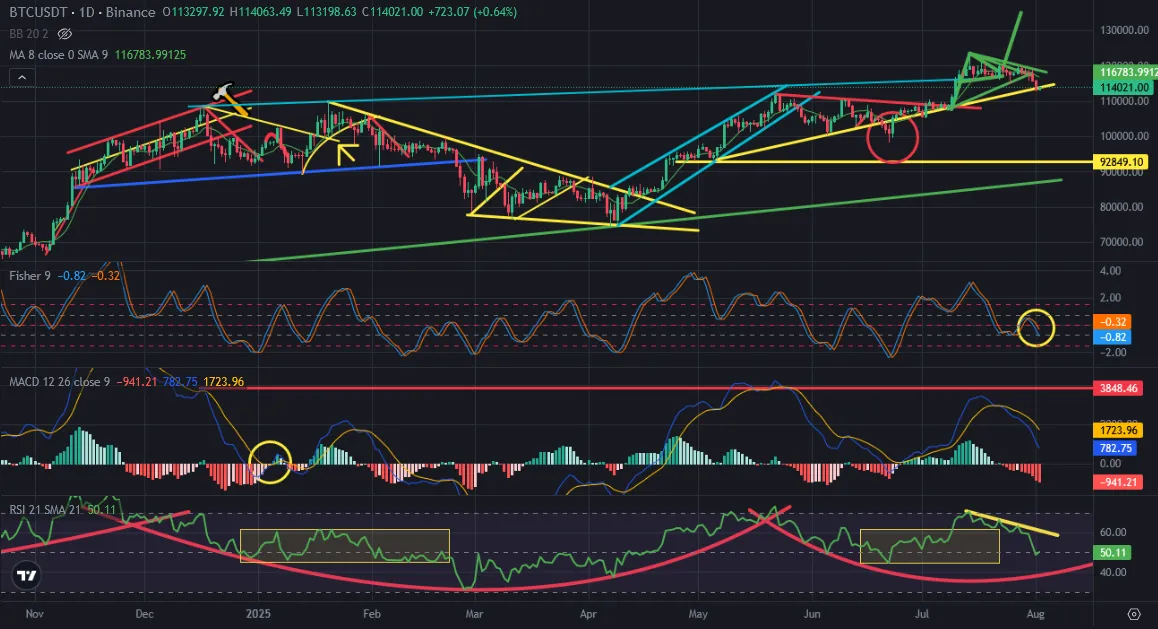
Here you can see the indicators on daily chart of Bitcoin price. Fisher Indicator is goind down. It is at the middle of the road. We may see a few days going on on Fisher Indicator. MACD Indicator is also at correction. There is downtrend line on RSI Indicator. We can see why Bitcoin price is under resistance and going down. Bitcoin should break up these resistances on the indicators.
August may be consolidation month for Bitcoin price chart. We may see good chances at crypto market to pick up from discounted prices. Bitcoin may present us this chance.
We will see..