I once got the nodeinvestor.com video courses a couple of years back and still follow Nodeinvestor on his Youtube Channel I will be starting the 30 days by rewatching some of the basics even though I feel I have quite a good understanding already.
#1 Technical Analysis Basics
Definition Technical Analysis:
"Financial analysis that uses patterns in market data to identify trends and make predictions."
In other words, it is a market of supply and demand meaning for every buyer there needs to be a seller. The charts basically paint a picture of this market psychology. Technical Analysis is part Science and Art. On the one side, there are the cold statistics while on the art part is the interpretation of how you can read it along with the news. Everything comes down to probabilities and there are no guarantees. Technical Analysis does help you to look at these probabilities which allow you to make better decisions.
Technical Analysis is a Process
When you do TA, you basically ask questions like an investigator. That's the general trend, where are the top & bottoms, resistance and support zones, checking with other indicators,...
Candlestick Charts
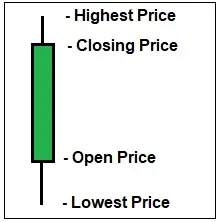
Other important indicators aside from the price are moving averages, Volume, RSI (relative Strength Index). The chart will look a bit different depending on the time interval you set it at. Since the crypto market is moving a lot quicker compared to the regular stock market you want to use the Daily timeframe if you want to see the longer-term trend and the 4-hour to see the shorter-term trends.
Charting Software
I am personally using the Free Version of Tradingview which is quite easy to use and offers plenty of options. It might be a bit confusing at the start but it's easy to get a hang on when you just play around with it a bit. In your watchlist, you can search the charts you want and add them. On the top, you can choose the candlestick options and timeframe you want your charts to show in.
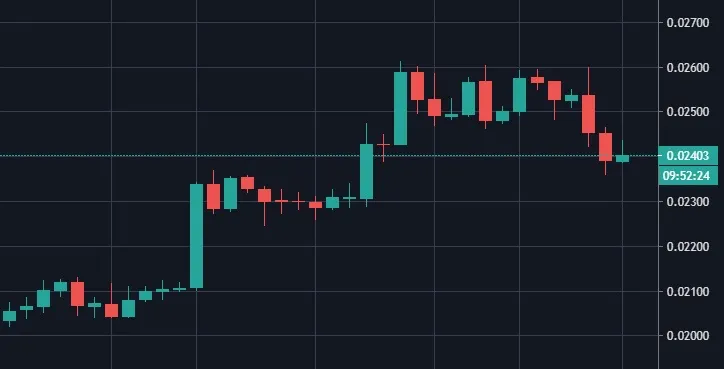
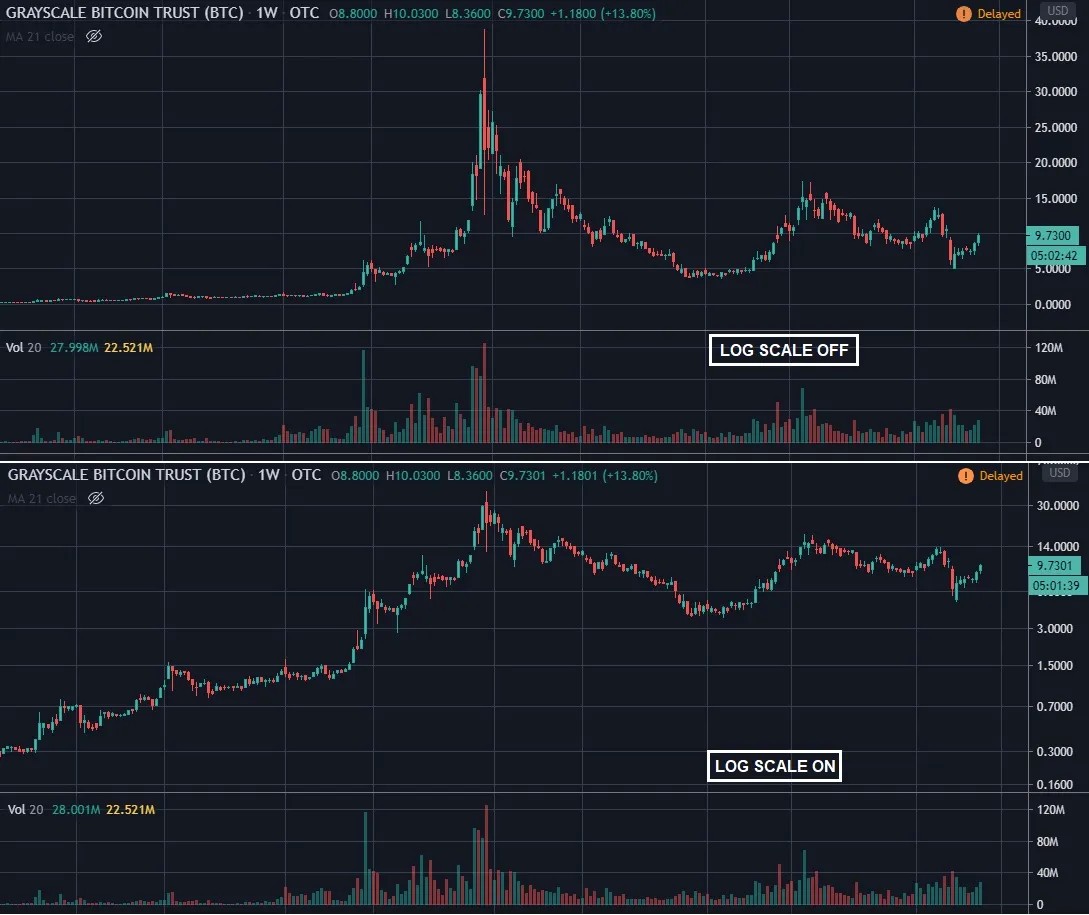
Log Scale
You want to toggle the Log Scale on (bottom right on the chart)as it will adjust the chart based on a percentage scale. since the prices can move so quickly a move from 1 dollar to 10 dollars (1000%) can be misrepresented compared to a move from 10$ to 20$ (100%). Log scale fixes this (See Image Below)
|
|
|
|