Hodl, dear members of Leofinance!
Now, I would like to comment on the price chart of Tezos - a PoS ecosystem for decentralized applications.
Let me remind you that, in the monthly time frame (MN), XTZ/USD formed a Shooting Star and something similar to a Bearish Engulfing - both are bearish candlestick patterns that usually occurs at the top of a price increase:
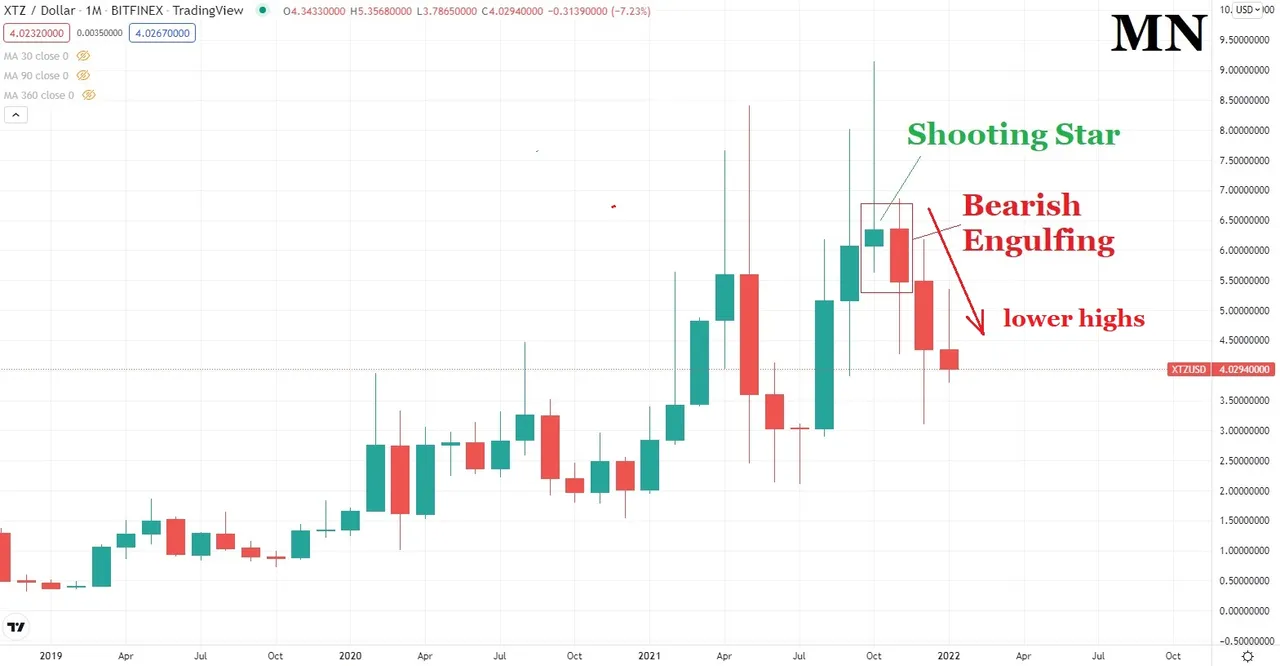
As can be seen from the chart, since then there has been a sequence of bearish candlesticks with lower highs. This is a signal that the bears continue to control the market.
Next, if we have a look at the weekly chart (1W), we can see that the uptrend remains in place:
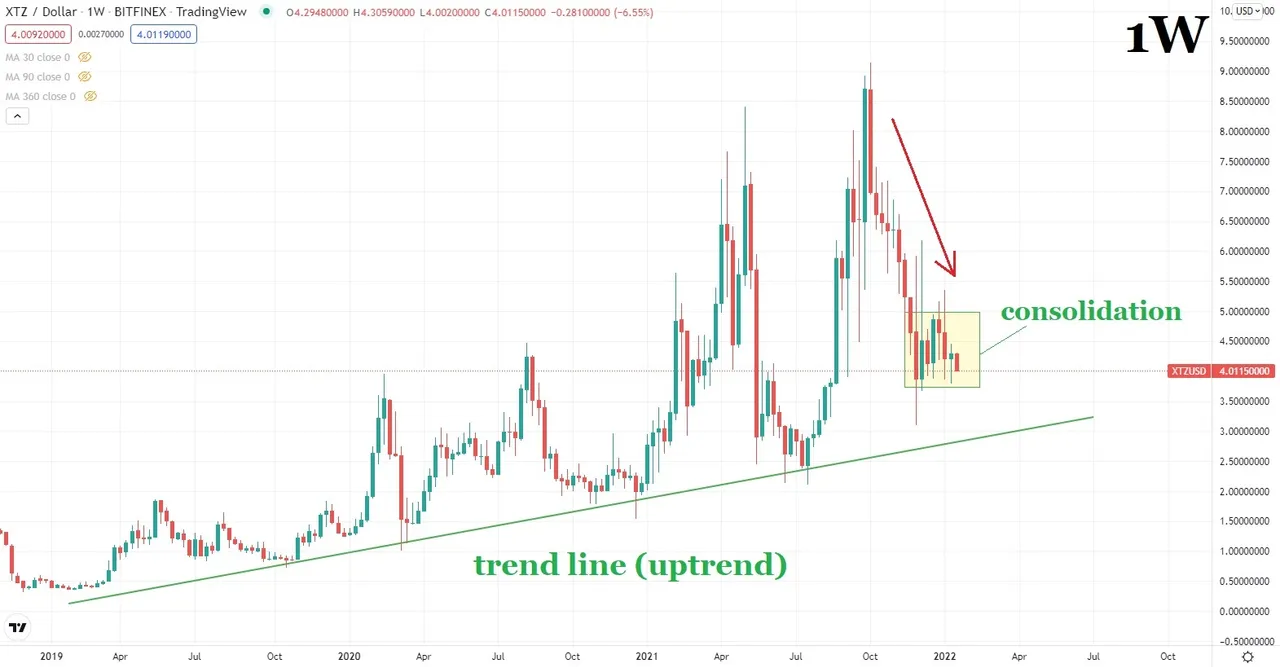
However, recently a deep correction (within the uptrend) started. Now, the bulls and the bears are taking a break and the price is consolidating. This consolidation range is still above the trend line. I consider the trend line as key support for the price.
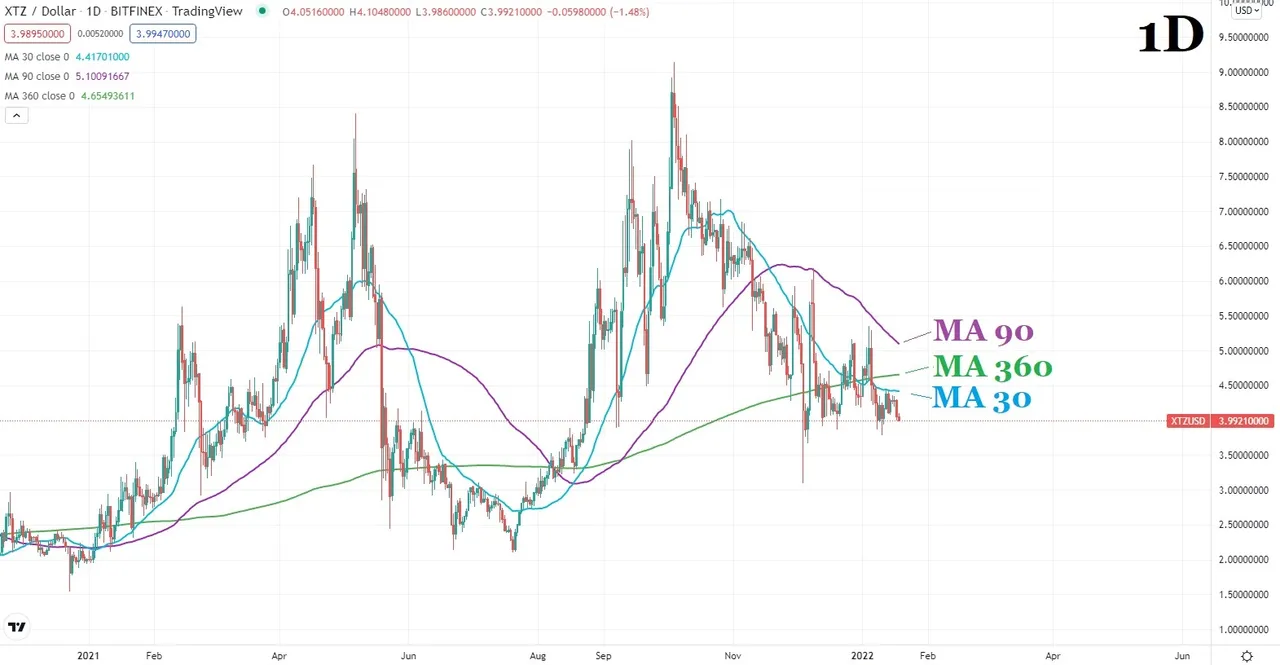
Although in the weekly time frame (1W) the uptrend continues, in the daily chart (1D), the bears control the market. XTZ/USD is below all three key Moving Averages (MAs), namely, below the 30-day Moving Average (MA 30), the 90-day Moving Average (MA 90), and the 360-day Moving Average (MA 360):
The 4-hour chart (4H) brings a small piece of optimism. XTZ/USD has exited the Descending channel (downtrend):
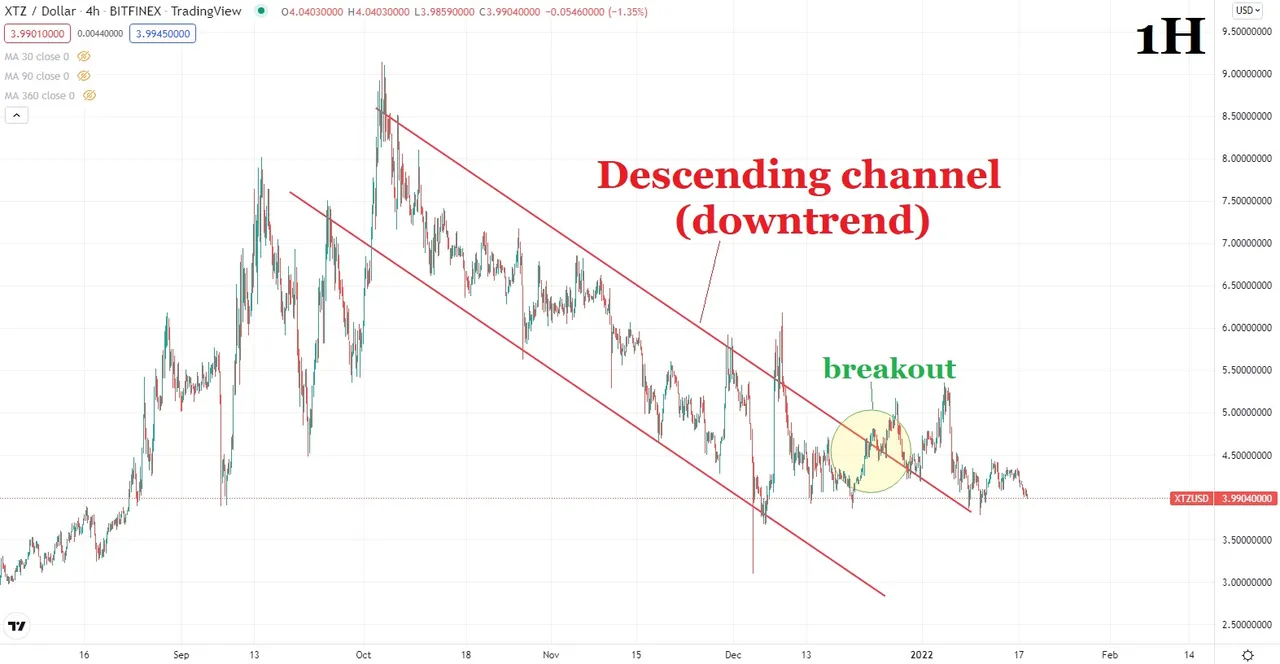
As can be seen from the chart, a breakout took place, and now the price is moving sideways. Let's see if the change of sentiment from bearish to bullish will start.
To be continued ...
As of the time of writing, one XTZ costs $3,99 on the Bitfinex exchange, according to TradingView.
A few words about me:
Just to let you know: I've been working professionally as a currency analyst for the last 15 and a half years and as a cryptocurrency analyst for the last 4 and a half years.
Important!
Keep in mind, that thoughts expressed here are my own, and they should not be regarded as recommendations for any cryptocurrency/commodity trades, investments and etc.