Curve is a stablecoins specific DEX! It is the top DEX if you want to swap between different stablecoins. Especially for larger sums. It provide the lowest slippage and fees for large swaps. Having in mind the growth of the stablecoins in the past two years, the DEX has positioned itself at a very important role in the industry.
Let’s take a look how it is doing under the current market conditions and all the failures of different market participants in 2022.
Curve has evolved and growth a lot in the last years. It has come to a point where other projects use it as a backend for their liquidity. It has become an industry provider for stablecoins liquidity. With the growth of the stabelcoins so has grown the project. But the year was extremely hard and especially with the UST collapse as a stablecoin and with it biggest liquidity was right on curve.
The movement in the Curve pool for UST market the end for the TerraLuna project.
Here we will be looking at:
- Total value locked
- Trading Volume
- Uniswap V2 VS V3 in trading volume
- Number of users DAUs MAUs
- Top Pairs
- Price
The period that we will be looking at is 2022.
The data here is compiled from different sources like DefiLama and Dune Analytics.
Total Value Locked
Here is the chart for the TVL on Curve in 2022.
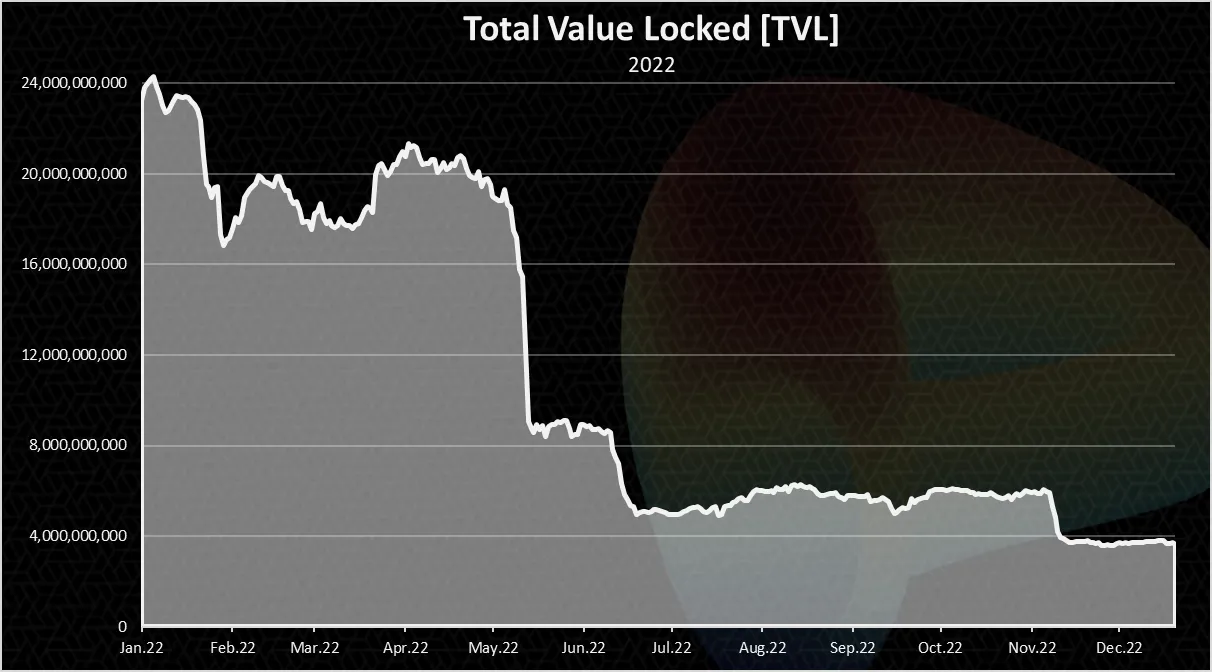
This chart is quite troubling!
A drop in the TVL on Curve from 24B to 4B where it is now. Four billion is still a lot of funds, but far from the 24B at the beginning of the year. A lot of defi projects have seen a drop in the TVL but this is probably one of the biggest ones in the top category. Uniswap for example has a drop from 9B to 3.5B.
The biggest drop that has happened on Curve is back in May when UST collapsed. This has left a huge mark on the protocol and the overall stablecoins market cap and industry. In a period of few days Curve lost more than 12B in TVL. From 20B down to 8B. Few weeks later there was another sharp drop, probably due to Tether FUD, down to 5B. In the summer period this TVL was more or less stable, even increased a bit to 6B, and then we hit another crisis with the FTX collapsed and the TVL down to 4B.
Trading Volume
Trading volume is extremely important. That is where the fees come from and the APR for liquidity providers. No trading volume means no fees and no capital in the protocol.
The chart for the trading volume looks like this.
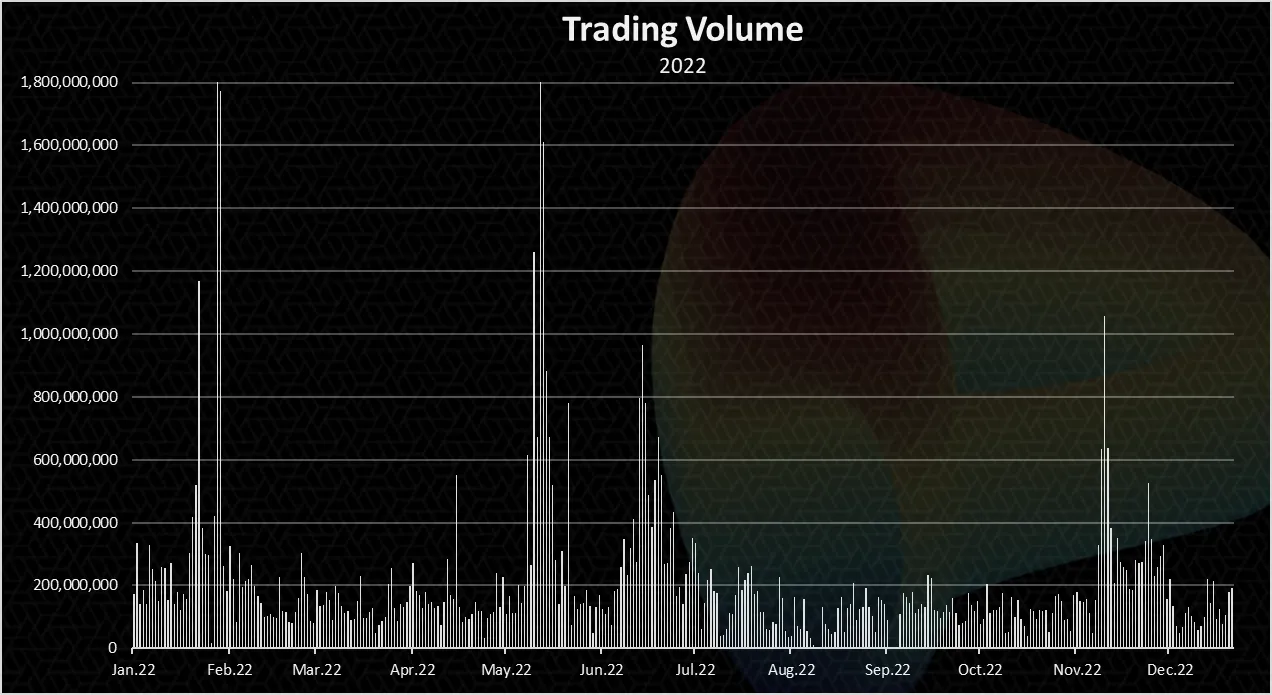
There are a few spikes in the trading volume up to 3B daily on occasions. This usually happens when there are some market volatility like with FTX and UST.
On regular days the trading volume in 2022 has been quite constant in the range of 100M to 200M per day. In the last 30 days the average trading volume is 200M per day.
DEX VS CEX Volume
If we take a look at the data for the trading volume on the other exchanges provided by some of the aggregators like coingecko the numbers looks like this.
An example for December 21, 2022:
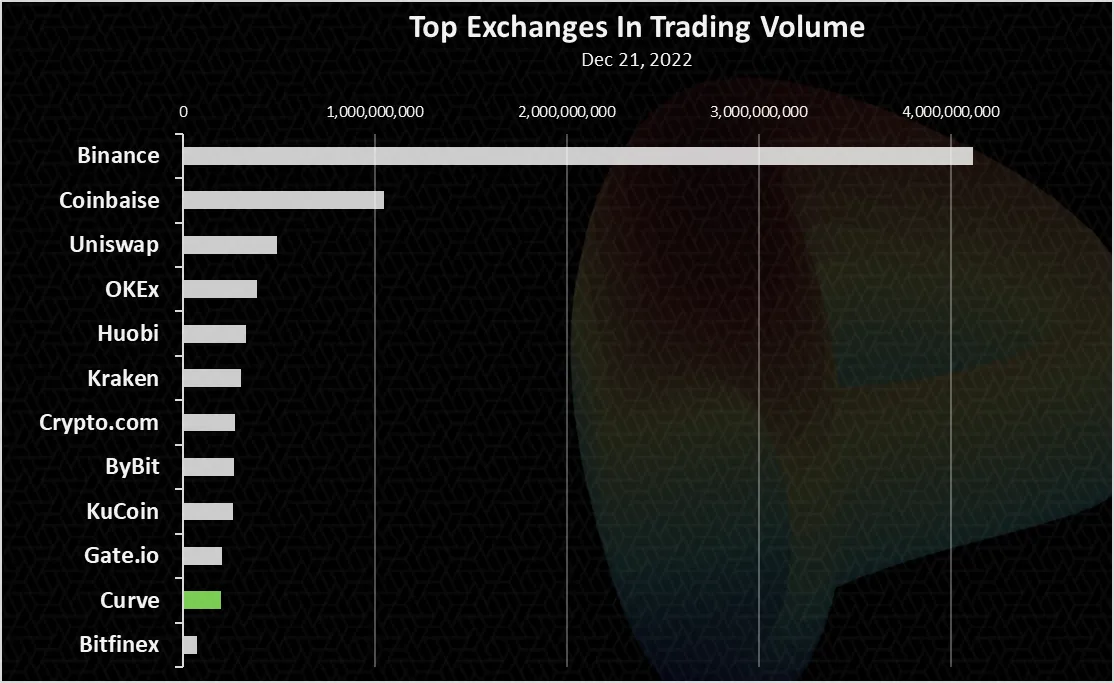
We can notice Curve just made it in the top ten exchanges in all the categories with 200M per day.
Binance is still dominant with more than 4B now, followed by Coinbase with 1B. Uniswap is now no.3 exchange in the world, and it is a DEX. It has around 500M daily volume these days.
Curve comes on the second spot from all the DEXs, just after Uniswap.
Active Users
How many users Curve has? Here is the chart.
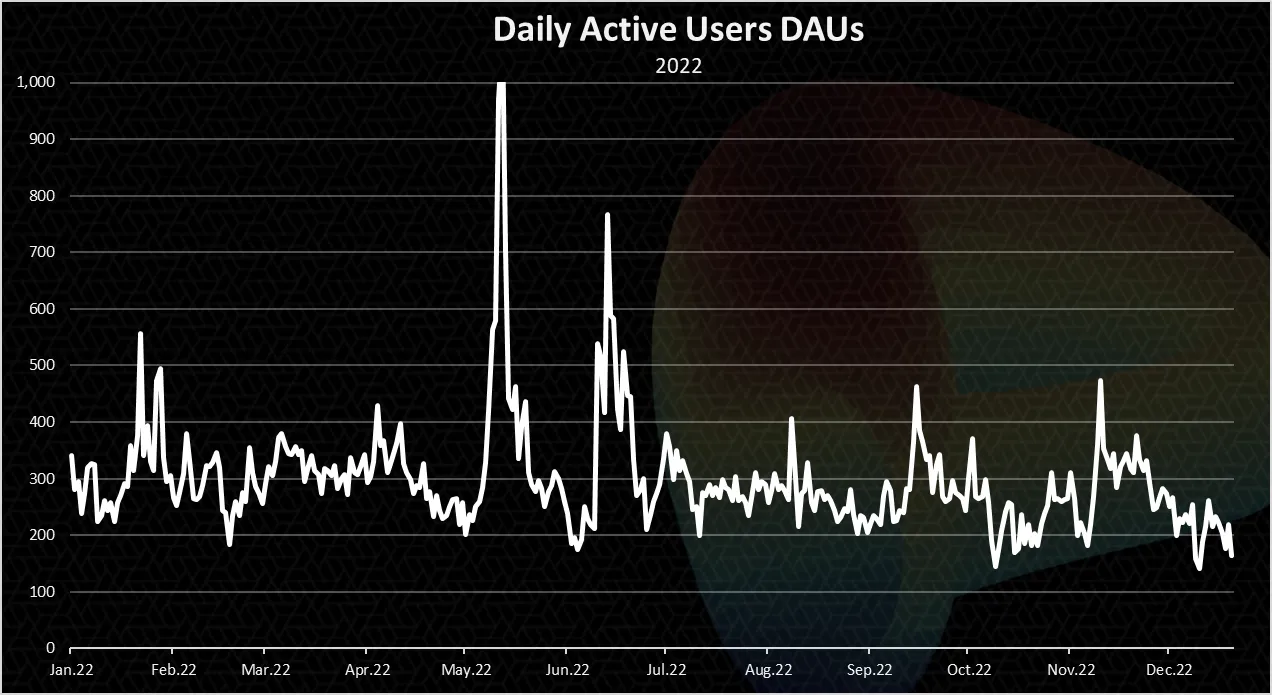
Curve has not that many users, but the numbers seem quite constant. Throughout all the year there has been around 300 DAUs. This again shows the protocol is used on an industrial level, from other apps and not by individual users. It makes sense since its primary use is for large stablecoins swaps. Not a lot users have a large amounts stablecoins to swap around.
On a monthly basis the chart looks like this.
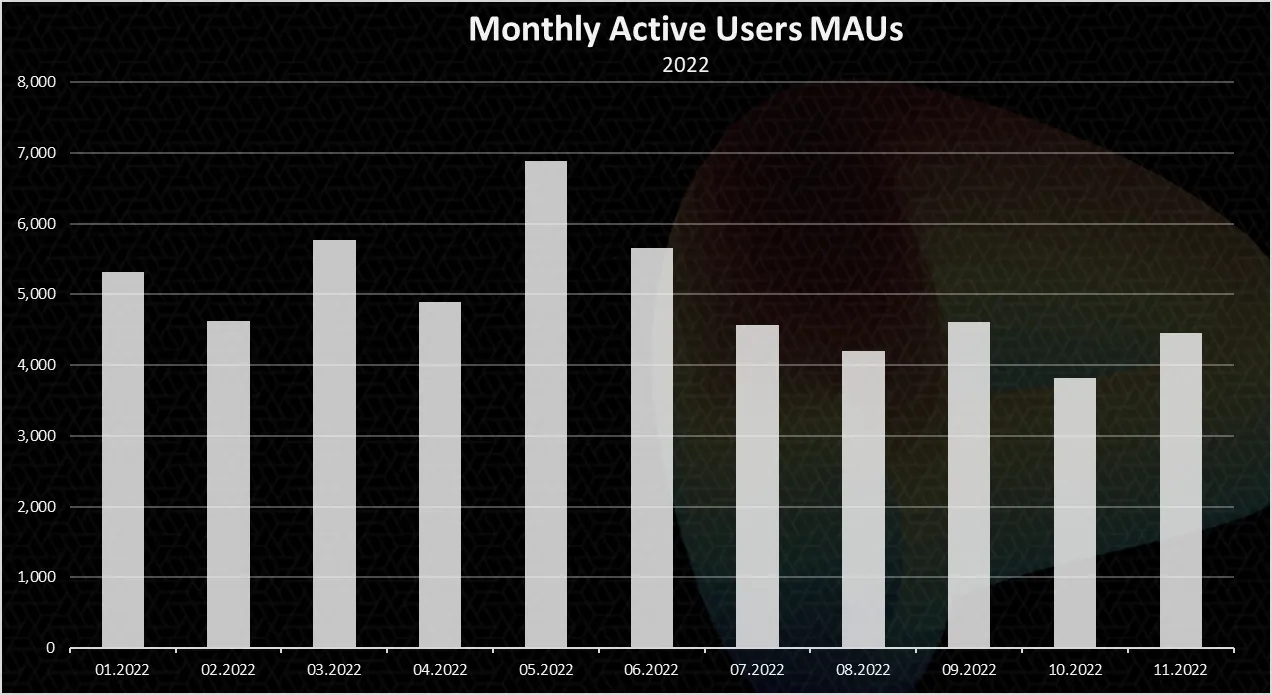
The number of monthly users is a bit higher than the daily ones and it is around 4k. There has been an increase in May to 7k monthly users and a drop afterwards. In November the numbers has been around 4500.
Top Liquidity Pools on Curve
Here is the chart for the top pools ranked by liquidity.
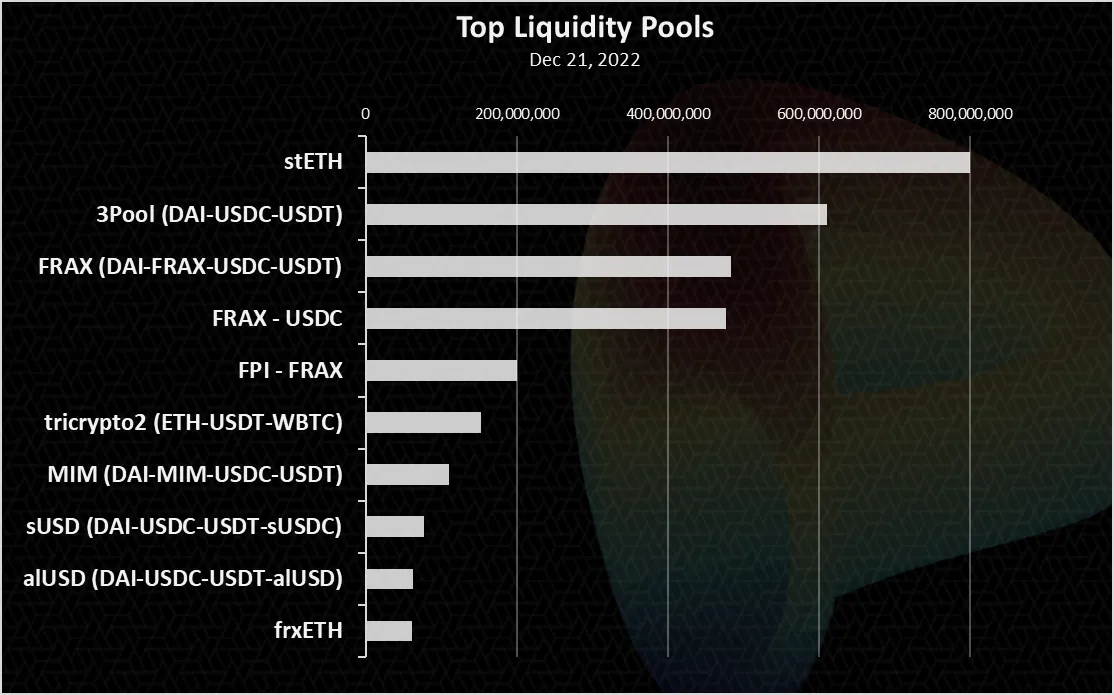
The staked ETH is on the top here with a value of 800M at the moment.
The other pools are predominantly stablecoins. The 3Pool (DAI-USDC-USDT) has been one of the major ones traditionally with a 600M at the moment. Then comes the FRAX pool, for the FRAX stablecoin and the other three stablecoins almost 500M.
The tricrypto2 (ETH-USDT-WBTC) is in the top as well with almost 200M.
Price
The all time chart for the CRV price looks like this.
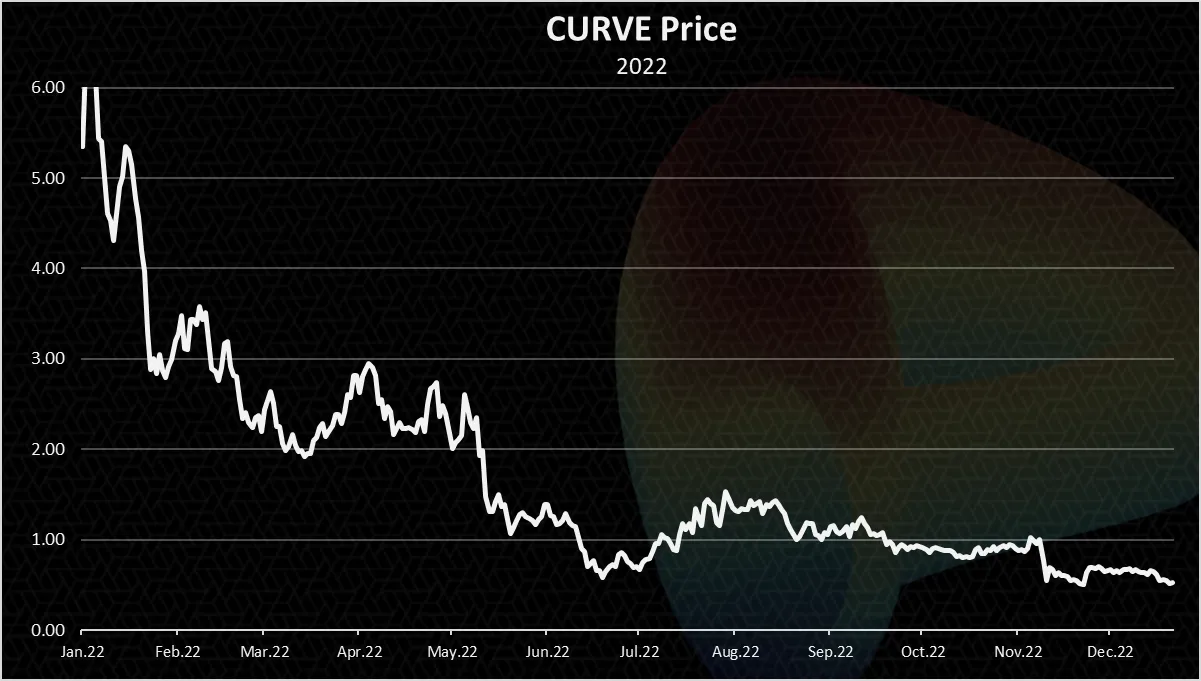
Quite the downtrend for the token. The bear market has been especially rough for defi coins and CRV is not an exception. The year started with a token price of 6$ . Then a sharp drop all the way to 3$ and it stayed in the range of 2$ to 3$ . After May it dropped under 1$. There was a small recovery in the summer of 2022 and a downtrend since then. Now the Curve token sits at around 50 cents.
Curve has established itself as the number one platform for stablecoins and has gathered a massive liquidity. 2022 has been a rough year for the project losing a lot of liquidity from 24B to 4B. But in terms of trading volume the drop has not been as big, and it has remained constant around 200M.
The numbers of users has also remained quite steady with 300 DAUs and 5k MAUs. stETH is the top liquidty pool followed by the stablecoins. The price has taken a big drop from 6$ to 0.5$
All the best
@dalz