versión en español disponible aquí
En posts anteriores, empezamos a construir un bot de trading usando la API de Binance. Cubrimos la configuración inicial, implementamos la sincronización de datos y ejecutamos operaciones de trading basadas en medias móviles y análisis de tendencias. En este post, exploraremos estrategias de backtesting para evaluar el rendimiento de nuestro bot de trading utilizando datos históricos.
Descargo de responsabilidad
La información proporcionada en este post es sólo para fines educativos y no debe interpretarse como asesoramiento de inversión. El trading automatizado conlleva un alto riesgo en el que se puede perder el capital invertido. Es importante hacer su propia investigación antes de tomar cualquier decisión de inversión.
Backtesting
Las pruebas retrospectivas o backtesting son un paso crucial en el desarrollo de estrategias de trading. Nos permite evaluar el rendimiento de nuestro bot en el pasado en distintas condiciones de mercado. Al simular operaciones con datos históricos, podemos conocer la eficacia de nuestra estrategia e identificar áreas de mejora. Para realizar esto, necesitamos acceso a datos históricos de precios. Binance proporciona datos históricos en su API que nos permite recuperar datos de velas para un par de negociación y un rango de tiempo específicos. Podemos utilizar estos datos para simular operaciones y evaluar el rendimiento de nuestra estrategia.
Importación de bibliotecas necesarias y configuración
Primero, importamos las librerías necesarias como <>pandas, numpy, matplotlib.pyplot (para la visualizacion final), y el cliente API de Binance. También importamos el módulo binance_utils, que contiene funciones de ayuda, y el módulo config, que almacena las credenciales de la API.
import pandas as pd
import numpy as np
import matplotlib.pyplot as plt
from binance.client import Client
import binance_utils as utl
from config import *
Configuración de parámetros
A continuación, definimos varios parámetros para personalizar la estrategia de trading:
crypto y ref : Símbolos de criptomoneda y moneda de referencia.
symbol : Concatenación de los símbolos crypto y ref.
ema_f, ema_s, y sma : Las medias móviles utilizadas para la estrategia.
amount : Importe de cada operación en la moneda de referencia.
take_profit y stop_loss : Valores porcentuales para take profit y stop loss.
initial_balance_crypto e initial_balance_ref : Saldos iniciales para criptomonedas y monedas de referencia.
kline_interval, start y finish : Parámetros para la obtención de datos históricos.
client = Client(API_KEY, API_SECRET)
crypto = 'HIVE'
ref = 'USDT'
symbol = f'{crypto}{ref}'
# moving average periods
ema_f = 5
ema_s = 15
sma = 200
# operation size ref
amount = 15
# % on take profit and stop loss
take_profit = 2 /100
stop_loss = 6 /100
# initial balances
initial_balance_crypto = 100
initial_balance_ref = 100
# historic data params
kline_interval = Client.KLINE_INTERVAL_15MINUTE
start = "5 Jul, 2022"
finish = "5 Jul, 2023"
Inicialización de datos
La función
initialize_dataframe() recupera datos históricos de precios usando la API de Binance e inicializa un pandas DataFrame con las columnas requeridas. Esta función se llama dentro de la función parser(), que procesa aún más los datos y añade columnas para medias móviles exponenciales, media móvil simple, tendencia, operación, y balances.
def initialize_dataframe():
    candles = client.get_historical_klines(symbol, kline_interval, start, finish)
    df = pd.DataFrame(candles)
    df = df.drop([6, 7, 8, 9, 10, 11], axis=1)
    df.columns = ['time', 'open', 'high', 'low', 'close', 'volume']
    df[['time', 'open', 'high', 'low', 'close', 'volume']] = df[['time', 'open', 'high', 'low', 'close', 'volume']].astype(float)
    df['time'] = pd.to_datetime(df['time'] * 1000000)
    return df
def parser():
    df = initialize_dataframe()
    df = pd.read_csv(f'./{symbol}_15M.csv')
    df['ema_s'] = df['close'].ewm(span=ema_s).mean()
    df['ema_f'] = df['close'].ewm(span=ema_f).mean()
    df['sma'] = df['close'].rolling(window=sma).mean()
    df['trend'] = np.nan
    df['operation'] = np.nan
    df['balance_crypto']= np.nan
    df['balance_ref']= np.nan
    df['profit']= np.nan
    return df
Lógica de backtesting
La lógica de simulacion de nuestra estrategia de trading reside en la función
backtest(df). Utiliza un bucle para iterar a través de las filas del DataFrame y simular operaciones de trading basadas en la estrategia definida. Estos son los pasos principales:
- Establece el saldo inicial de las monedas cripto y de referencia.
- Aplica la lógica de nuestro bot basada en cruces de medias móviles y condiciones de tendencia.
- Calcula las cantidades de compra/venta y actualiza los saldos en consecuencia.
- Aplica niveles de take profit y stop loss para simular las órdenes OCO.
- Registra el tipo de operación, el saldo y el beneficio en el DataFrame.
- Guarda los resultados del backtest en un archivo CSV.
- Muestra una grafica que representa el rendimiento de la estrategia.
def backtest(df):
    balance_ref = initial_balance_ref
    balance_crypto = initial_balance_crypto
    opened_order = False
    i = sma
    while i < len(df):
        operation = None
        price = df['close'].iloc[i-1]
        # get trend, price 0.5% up or down SMA
        if df['close'].iloc[i-1] > df['sma'].iloc[i-1]*1.005:
            df['trend'].iloc[i] = 'up'
        elif df['close'].iloc[i-1] < df['sma'].iloc[i-1]*0.995:
            df['trend'].iloc[i] = 'down'
        else:
            df['trend'].iloc[i] = None
        if opened_order is False:
            if utl.crossover((df['ema_f'].iloc[i-1], df['ema_f'].iloc[i]),(df['ema_s'].iloc[i-1], df['ema_s'].iloc[i])) and df['trend'].iloc[i] == 'up':
                quantity = utl.get_quantity(price, amount, min_qty, max_qty, max_float_qty)
                if  balance_ref >= amount:
                    operation = 'BUY'
                    balance_ref = balance_ref - (quantity * price)
                    balance_crypto = balance_crypto + quantity
                    opened_order = True
                    order_type = 'SELL'
                    sell_price = ((price *(1+take_profit)) // tick_size) * tick_size
                    stop_price = ((price*(1-stop_loss)) // tick_size) * tick_size
                    stop_limit_price = ((price*(1-stop_loss)) // tick_size) * tick_size
            elif utl.crossover((df['ema_s'].iloc[i-1], df['ema_s'].iloc[i]),(df['ema_f'].iloc[i-1], df['ema_f'].iloc[i])) and df['trend'].iloc[i] == 'down':
                quantity = utl.get_quantity(price, amount, min_qty, max_qty, max_float_qty)
                if quantity <= balance_crypto:
                    operation = 'SELL'
                    balance_crypto = balance_crypto - quantity
                    balance_ref = balance_ref + (quantity * price)
                    opened_order = True
                    order_type = 'BUY'
                    buy_price = ((price*(1-take_profit)) // tick_size) * tick_size
                    stop_price = ((price*(1+stop_loss)) // tick_size) * tick_size
                    stop_limit_price = ((price*(1+stop_loss)) // tick_size) * tick_size
                    quantity = utl.get_quantity(buy_price, amount, min_qty, max_qty, max_float_qty)
        elif opened_order:
            if order_type == 'SELL':
                if price >= sell_price:
                    balance_ref = balance_ref + (quantity * sell_price)
                    balance_crypto = balance_crypto - quantity
                    operation = 'SELL'
                    opened_order = False
                elif price <= stop_price:
                    balance_ref = balance_ref + (quantity * stop_limit_price)
                    balance_crypto = balance_crypto - quantity
                    operation = 'SELL'
                    opened_order = False
            elif order_type == 'BUY':
                if price <= buy_price:
                    balance_crypto = balance_crypto + quantity
                    balance_ref = balance_ref - (quantity * buy_price)
                    operation = 'BUY'
                    opened_order = False
                elif price >= stop_price:
                    balance_crypto = balance_crypto + quantity
                    balance_ref = balance_ref - (quantity * stop_limit_price)
                    operation = 'BUY'
                    opened_order = False
        df['operation'].iloc[i]= operation
        df['balance_crypto'].iloc[i]= balance_crypto
        df['balance_ref'].iloc[i]= balance_ref
        profit_crypto = round(balance_crypto - initial_balance_crypto,8)
        profit_ref = round(balance_ref - initial_balance_ref,2)
        total_profit = round(profit_ref + (profit_crypto * price),2)
        df['profit'].iloc[i]= total_profit
        i+=1
    df.to_csv(f'{symbol}_MF:{ema_f}_MS:{ema_s}_MA:{sma}_TP:{int(take_profit*100)}_SL:{int(stop_loss*100)}.csv')
      print("Backtesting Results:")
    print(f'EMAF: {ema_f} EMAS: {ema_s} SMA: {sma} TP: {int(take_profit*100)} SL: {int(stop_loss*100)}\n')
    print(f"Profit {crypto}: {round(profit_crypto, 8)} = {round(profit_crypto*price,2)} {ref}")
    print(f"Profit {ref}: {round(profit_ref,2)}")
    print(f"Total Profit : {total_profit} {ref}")
    df.plot(x="time", y="profit", figsize=(10,5), legend=False)
    plt.title(f'{symbol} EMAF:{ema_f} EMAS:{ema_s} SMA:{sma} TP:{int(take_profit*100)}% SL:{int(stop_loss *100)}%')
    plt.xlabel('Time')
    plt.ylabel('Profit')
    plt.xticks(rotation=45)
    plt.show()
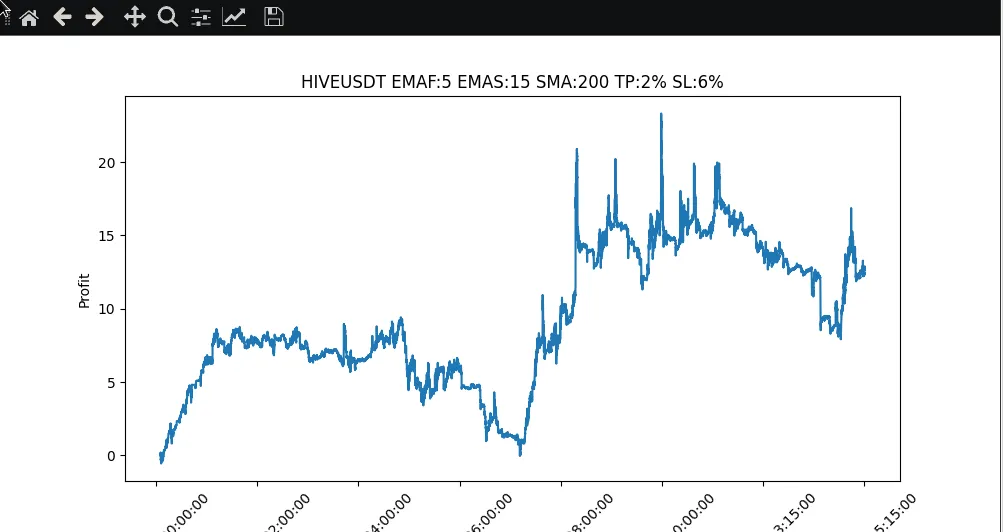
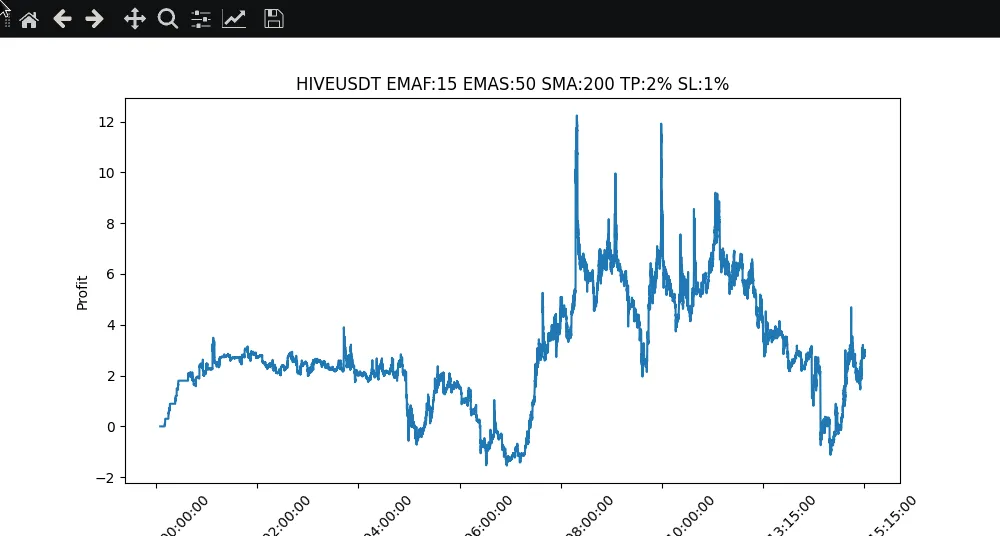
Optimización de parametros
El backtesting nos permite optimizar nuestra estrategia de trading probando distintos parámetros y evaluar su rendimiento. Comparando los resultados, podemos identificar los ajustes de parámetros más eficaces para nuestra estrategia.
  |
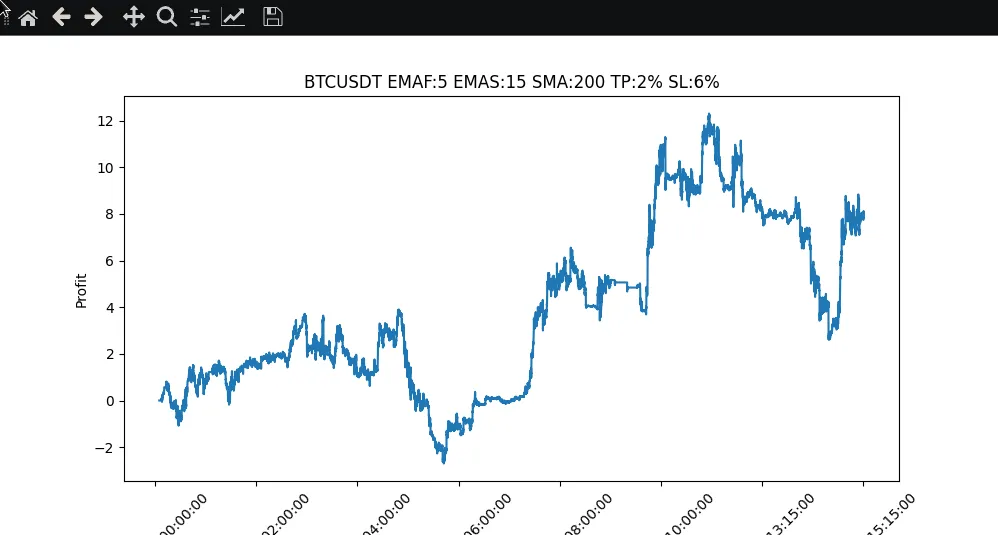 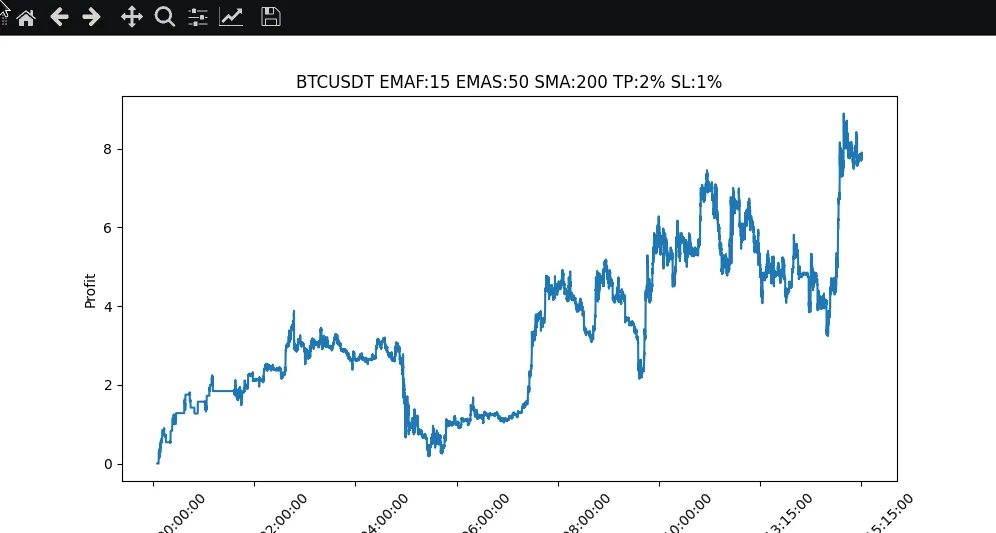 |

Pues bien, hemos explorado la importancia de las estrategias de backtesting en el desarrollo de bots de trading de criptomonedas. Aprendimos cómo obtener datos históricos de precios de Binance e implementamos las modificaciones de código necesarias para permitir el backtesting. Mediante la evaluación de las métricas de rendimiento y la visualización de los resultados, podemos obtener información valiosa sobre la rentabilidad de la estrategia y el perfil de riesgo. Además, el backtesting nos permite optimizar la estrategia probando diferentes parámetros. En un post futuro, nos centraremos en la implementación de indicadores adicionales para mejorar el rendimiento del bot, ya que como podemos ver con solo las medias moviles no conseguimos un ROI atractivo, a pesar de mantener un balance positivo.
Es importante recalcar que los resultados del backtesting se basan en datos históricos y no garantizan el rendimiento futuro. Es esencial validar la estrategia en tiempo real y supervisarla y ajustarla continuamente a medida que cambian las condiciones del mercado.
Recuerda que el código proporcionado es sólo para fines educativos. Operar con criptomonedas implica riesgos, y el rendimiento pasado no es indicativo de resultados futuros. Investiga siempre a fondo y busca asesoramiento profesional antes de tomar cualquier decisión financiera.
Puedes consultar todo este código en mi GitHub y si tienes alguna pregunta o sugerencia no dudes en dejar un comentario.
referencias: python-binance

In previous posts, we started building a trading bot using the Binance API. We covered the initial setup, implemented data synchronization, and performed trading operations based on moving averages and trend analysis. In this post, we will explore backtesting strategies to evaluate the performance of our trading bot using historical data.
Disclaimer
The information provided in this post is for educational purposes only and should not be construed as investment advice. Automated trading carries a high risk in which the invested capital can be lost. It is important to do your own research before making any investment decisions.
Backtesting
Backtesting is an important step in the development of trading strategies. It allows us to evaluate the performance of our bot in the past under different market conditions. By simulating trades with historical data, we can learn about the effectiveness of our strategy and identify areas for improvement. To do this, we need access to historical price data. Binance provides historical data in its API, which allows us to retrieve candlestick data for a specific trading pair and time period. We can use this data to simulate trades and evaluate the performance of our strategy.
Importing the necessary libraries and configuration
First, we import the necessary libraries such as pandas, numpy, matplotlib.pyplot (for the final visualization), and the Binance API client. We also import the binance_utils module, which contains helper functions, and the config module, which stores the API credentials.
import pandas as pd
import numpy as np
import matplotlib.pyplot as plt
from binance.client import Client
import binance_utils as utl
from config import *
Parameter settings
Below we define some parameters to customize the trading strategy:
crypto and ref : Cryptocurrency and reference currency symbols.symbol : Concatenation of crypto and ref symbols.ema_f, ema_s, and sma : The moving averages used by the strategy.amount : Amount of each trade in the reference currency.take_profit and stop_loss : Take Profit and Stop Loss percentages.initial_balance_crypto and initial_balance_ref : Initial balances for cryptocurrencies and reference currencie.kline_interval, start y finish : Parameters to retrieve historical data.
client = Client(API_KEY, API_SECRET)
crypto = 'HIVE'
ref = 'USDT'
symbol = f'{crypto}{ref}'
# moving average periods
ema_f = 5
ema_s = 15
sma = 200
# operation size ref
amount = 15
# % on take profit and stop loss
take_profit = 2 /100
stop_loss = 6 /100
# initial balances
initial_balance_crypto = 100
initial_balance_ref = 100
# historic data params
kline_interval = Client.KLINE_INTERVAL_15MINUTE
start = "5 Jul, 2022"
finish = "5 Jul, 2023"
Data Initialization
The initialize_dataframe() function retrieves historical quote data using the Binance API and initializes a Pandas DataFrame with the required columns. This function is called within the parser() function which further processes the data and adds columns for exponential moving averages, simple moving averages, trend, trade and balances.
def initialize_dataframe():
    candles = client.get_historical_klines(symbol, kline_interval, start, finish)
    df = pd.DataFrame(candles)
    df = df.drop([6, 7, 8, 9, 10, 11], axis=1)
    df.columns = ['time', 'open', 'high', 'low', 'close', 'volume']
    df[['time', 'open', 'high', 'low', 'close', 'volume']] = df[['time', 'open', 'high', 'low', 'close', 'volume']].astype(float)
    df['time'] = pd.to_datetime(df['time'] * 1000000)
    return df
def parser():
    df = initialize_dataframe()
    df = pd.read_csv(f'./{symbol}_15M.csv')
    df['ema_s'] = df['close'].ewm(span=ema_s).mean()
    df['ema_f'] = df['close'].ewm(span=ema_f).mean()
    df['sma'] = df['close'].rolling(window=sma).mean()
    df['trend'] = np.nan
    df['operation'] = np.nan
    df['balance_crypto']= np.nan
    df['balance_ref']= np.nan
    df['profit']= np.nan
    return df
Backtesting Logic
The backtesting logic of our trading strategy is contained in the backtest(df) function. It uses a loop to iterate through the rows of the DataFrame and simulate trading operations based on the defined strategy. Here are the main steps:
- Set the initial balance of the crypto and reference currencies.
- Apply our bot logic based on moving average crossings and trend conditions.
- Calculate buy/sell amounts and update balances accordingly.
- Applies Take Profit and Stop Loss levels to simulate OCO orders.
- Records trade type, balance and profit in DataFrame.
- Saves backtest results to a CSV file.
- Displays a graph showing the performance of the strategy.
def backtest(df):
    balance_ref = initial_balance_ref
    balance_crypto = initial_balance_crypto
    opened_order = False
    i = sma
    while i < len(df):
        operation = None
        price = df['close'].iloc[i-1]
        # get trend, price 0.5% up or down SMA
        if df['close'].iloc[i-1] > df['sma'].iloc[i-1]*1.005:
            df['trend'].iloc[i] = 'up'
        elif df['close'].iloc[i-1] < df['sma'].iloc[i-1]*0.995:
            df['trend'].iloc[i] = 'down'
        else:
            df['trend'].iloc[i] = None
        if opened_order is False:
            if utl.crossover((df['ema_f'].iloc[i-1], df['ema_f'].iloc[i]),(df['ema_s'].iloc[i-1], df['ema_s'].iloc[i])) and df['trend'].iloc[i] == 'up':
                quantity = utl.get_quantity(price, amount, min_qty, max_qty, max_float_qty)
                if  balance_ref >= amount:
                    operation = 'BUY'
                    balance_ref = balance_ref - (quantity * price)
                    balance_crypto = balance_crypto + quantity
                    opened_order = True
                    order_type = 'SELL'
                    sell_price = ((price *(1+take_profit)) // tick_size) * tick_size
                    stop_price = ((price*(1-stop_loss)) // tick_size) * tick_size
                    stop_limit_price = ((price*(1-stop_loss)) // tick_size) * tick_size
            elif utl.crossover((df['ema_s'].iloc[i-1], df['ema_s'].iloc[i]),(df['ema_f'].iloc[i-1], df['ema_f'].iloc[i])) and df['trend'].iloc[i] == 'down':
                quantity = utl.get_quantity(price, amount, min_qty, max_qty, max_float_qty)
                if quantity <= balance_crypto:
                    operation = 'SELL'
                    balance_crypto = balance_crypto - quantity
                    balance_ref = balance_ref + (quantity * price)
                    opened_order = True
                    order_type = 'BUY'
                    buy_price = ((price*(1-take_profit)) // tick_size) * tick_size
                    stop_price = ((price*(1+stop_loss)) // tick_size) * tick_size
                    stop_limit_price = ((price*(1+stop_loss)) // tick_size) * tick_size
                    quantity = utl.get_quantity(buy_price, amount, min_qty, max_qty, max_float_qty)
        elif opened_order:
            if order_type == 'SELL':
                if price >= sell_price:
                    balance_ref = balance_ref + (quantity * sell_price)
                    balance_crypto = balance_crypto - quantity
                    operation = 'SELL'
                    opened_order = False
                elif price <= stop_price:
                    balance_ref = balance_ref + (quantity * stop_limit_price)
                    balance_crypto = balance_crypto - quantity
                    operation = 'SELL'
                    opened_order = False
            elif order_type == 'BUY':
                if price <= buy_price:
                    balance_crypto = balance_crypto + quantity
                    balance_ref = balance_ref - (quantity * buy_price)
                    operation = 'BUY'
                    opened_order = False
                elif price >= stop_price:
                    balance_crypto = balance_crypto + quantity
                    balance_ref = balance_ref - (quantity * stop_limit_price)
                    operation = 'BUY'
                    opened_order = False
        df['operation'].iloc[i]= operation
        df['balance_crypto'].iloc[i]= balance_crypto
        df['balance_ref'].iloc[i]= balance_ref
        profit_crypto = round(balance_crypto - initial_balance_crypto,8)
        profit_ref = round(balance_ref - initial_balance_ref,2)
        total_profit = round(profit_ref + (profit_crypto * price),2)
        df['profit'].iloc[i]= total_profit
        i+=1
    df.to_csv(f'{symbol}_MF:{ema_f}_MS:{ema_s}_MA:{sma}_TP:{int(take_profit*100)}_SL:{int(stop_loss*100)}.csv')
      print("Backtesting Results:")
    print(f'EMAF: {ema_f} EMAS: {ema_s} SMA: {sma} TP: {int(take_profit*100)} SL: {int(stop_loss*100)}\n')
    print(f"Profit {crypto}: {round(profit_crypto, 8)} = {round(profit_crypto*price,2)} {ref}")
    print(f"Profit {ref}: {round(profit_ref,2)}")
    print(f"Total Profit : {total_profit} {ref}")
    df.plot(x="time", y="profit", figsize=(10,5), legend=False)
    plt.title(f'{symbol} EMAF:{ema_f} EMAS:{ema_s} SMA:{sma} TP:{int(take_profit*100)}% SL:{int(stop_loss *100)}%')
    plt.xlabel('Time')
    plt.ylabel('Profit')
    plt.xticks(rotation=45)
    plt.show()
Parameter Optimization
Backtesting allows us to optimize our trading strategy by testing different parameters and evaluating their performance. By comparing the results, we can identify the most effective parameter settings for our strategy.
|
|
|
Well, we explored the importance of backtesting strategies in the development of cryptocurrency trading bots. We learned how to obtain historical price data from Binance and made the necessary code changes to enable backtesting. By evaluating performance metrics and visualizing the results, we are able to gain valuable information about the profitability and risk profile of the strategy. In addition, backtesting allows us to optimize the strategy by testing different parameters. In a future post, we will focus on implementing additional indicators to improve the performance of the bot, since as we can see, with only moving averages we do not achieve an attractive ROI, despite maintaining a positive balance.
It is important to emphasize that backtesting results are based on historical data and do not guarantee future performance. It is essential to validate the strategy in real time and to continuously monitor and adjust it as market conditions change.
Remember that the code provided is for educational purposes only. Trading cryptocurrencies involves risk and past performance is not indicative of future results. Always do your research and seek professional advice before making any financial decisions.
You can check all this code on my GitHub and if you have any questions or suggestions please feel free to leave a comment.
references: python-binance