Note: I am not an expert on Terra or TerraUSD. I am happy to be corrected if there is a good reason for what I point out below, which is beyond my knowledge.
The supply graph
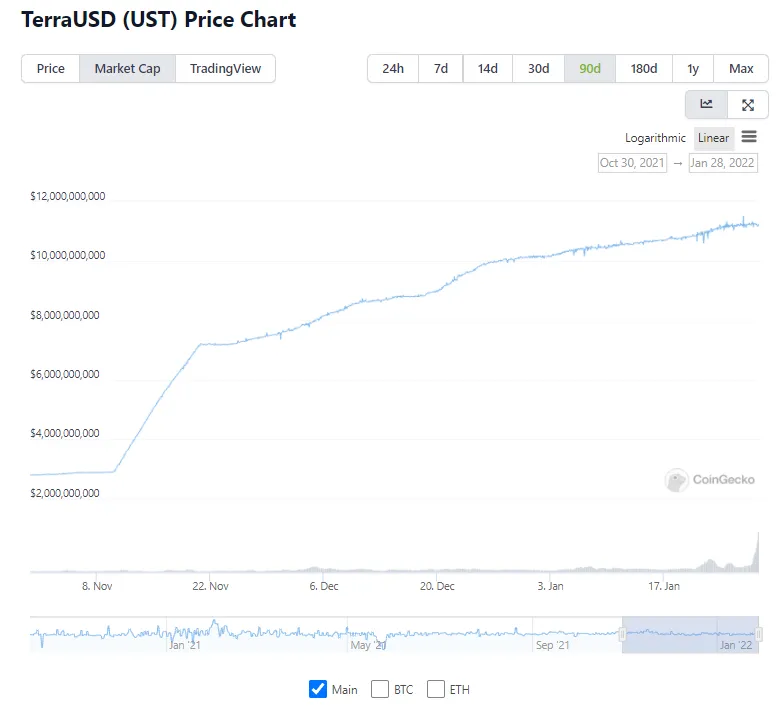
The above is the market cap graph of TerraUSD. Because the price of TerraUSD remains stable at $1, it can be used as a proxy for the supply chart.
Notice that it never goes down!* Natural demand for a token always ebbs and flows. It is never consistently growing. At times there will be more buying in (which causes an increase in supply), at other times there will be more selling (which should cause a decrease in supply). Here is the same graph but for the full period that TerraUSD has existed:
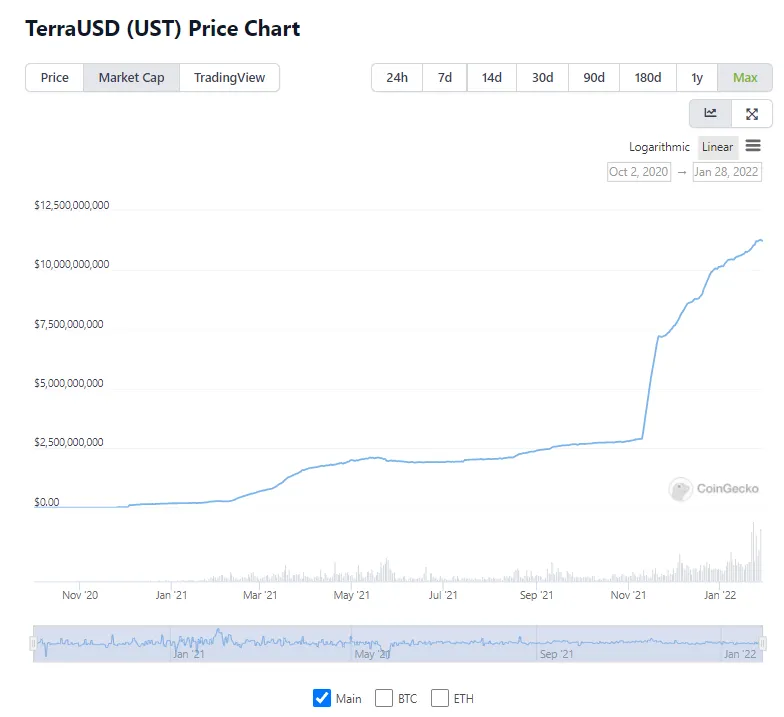
The only time that the market cap (and supply) has dropped for a meaningful time was around June. This is not a chart of natural demand. Compare it to HBD supply, for example:
Credit to @arcange
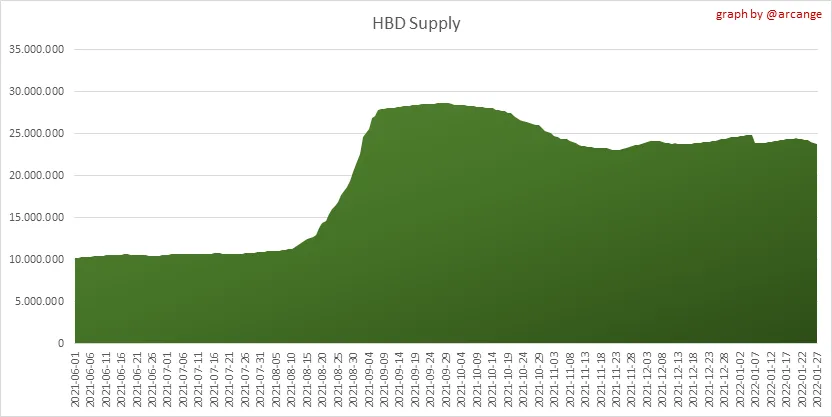
Supply of HBD goes up, and it also goes down. Supply is responding dynamically to changes in demand. Why is this not true for UST?
*except over very short periods of time