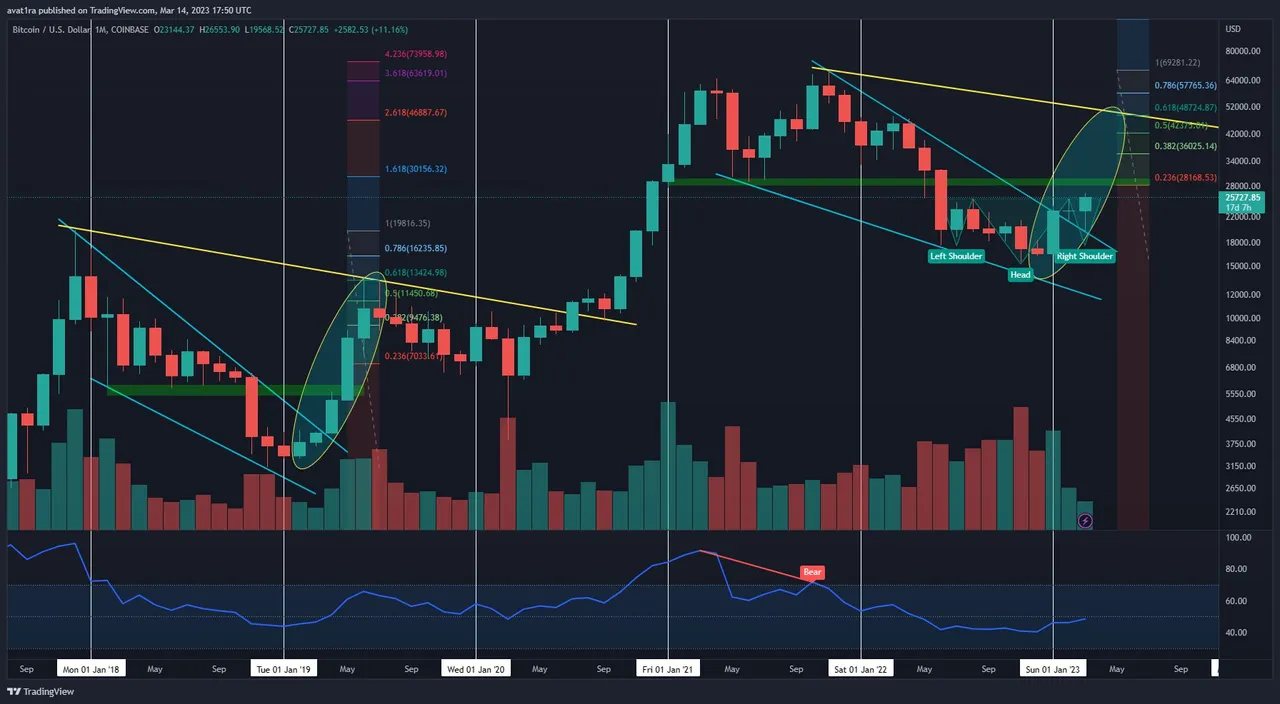
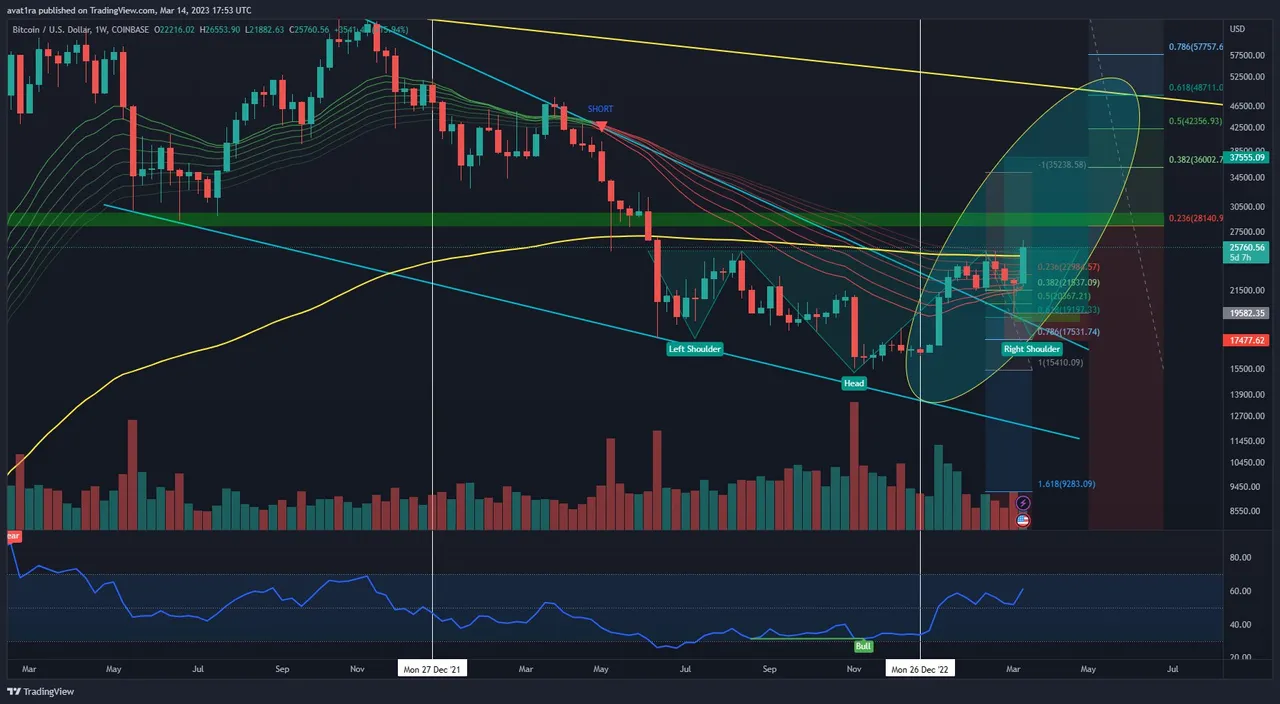
In my previous post I where talking about we had our breakout of the blue downtrend in january and retested with our february candle. Now we had a dump again and tested our trendline for 2nd time in march also, imo we also formed a inverse head & shoulder pattern. If we will break and close daily candle above 25k our neckline we should see the lvl of may 2022 at 28-33k as many alts have rallied to. If we go over I will target fib levels and my highest target would be as mentioned 48k at 0,618 fib, as our relief rally in 2019 that took us to same fib at 14k that time. Its easier to see on the weekly timeframe below.
As mentioned in previous post incase we had a dump then we will
probably come down to fill a CME gap at 20k. Bullish as long as we dont close daily candles below 200 MA at 19,5k
And we did fill it, it hit trendline and fibonaci golden pocket. This was perfect entry for a very good risk to reward trade. Had to dca so not all orders got filled.😊
I hope you enjoyed the read and leave a comment, will we go higher or is this a trap?
Please do follow if you want to keep up with my next crypto post. Any upvotes or reblogs are hugely appreciated!
Latest crypto post, check out :
BTC update - More upside on the monthly chart, it depends on DXY?
Christopher
Kristiansand, Norway
Source: Photos are chart-screenshots by me from Tradingview.com
Latest content: Travel, Art, Article, Photo