When someone asks a layman about his business he may reply that it is alright. But a technical man may reply that it is break even. So, Break Even means the volume of production or sales where there is no profit or loss. In other words, Break Even Point is the volume of production or sales where total costs are equal to revenue. It helps in finding out the relationship of costs and revenues to output. In understanding the breakeven point, cost, volume and profit are always used.
The formal break even chart is as follows:
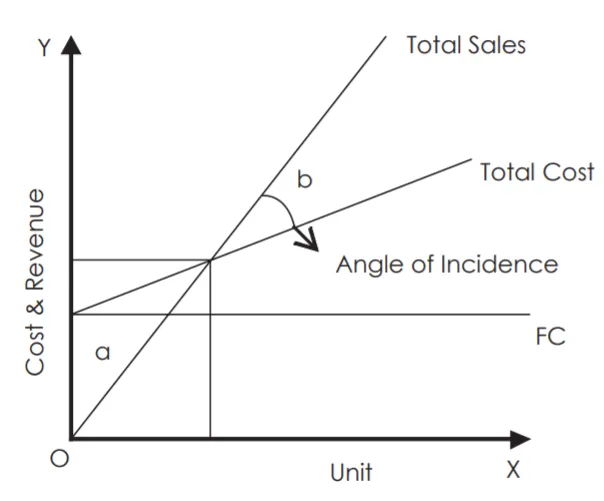
a = Losses
b = Profits
When number of units are expressed on X-axis and costs and revenues are expressed on Y-axis, three lines are drawn i.e., fixed cost line, total cost line and total sales line. In the above graph we find there is an intersection point of the total sales line and total cost line and from that intersection point if a perpendicular is drawn to X-axis, we find break even units. Similarly, from the same intersection point a parallel line is drawn to X-axis so that it cuts Y-axis, where we find Break Even point in terms of value. This is how, the formal pictorial representation of the Break Even chart.
At the intersection point of the total cost line and total sales line, an angle is formed called Angle of Incidence, which is explained as follows:
Angle of Incidence is an angle formed at the intersection point of total sales line and total cost line in a formal break even chart. If the angle is larger, the rate of growth of profit is higher and if the angle is lower, the rate of growth of profit is lower. So, growth of profit or profitability rate is depicted by Angle of Incidence.