Sunday low-volume pump fizzled.
The market is hypersensitive to every one percent move it seems. Going up a few points results in we-are-so-back while moving down becomes an it's-so-over moment. Classic psychology in play right now; everyone has them crab-market jitters. When will it end! Blackrock must be manipulating because number isn't going up! WAH! What if price is still $58k in ten years? Jebus.
The horror.
Meanwhile the actual analysis of the situation tells a completely different story.
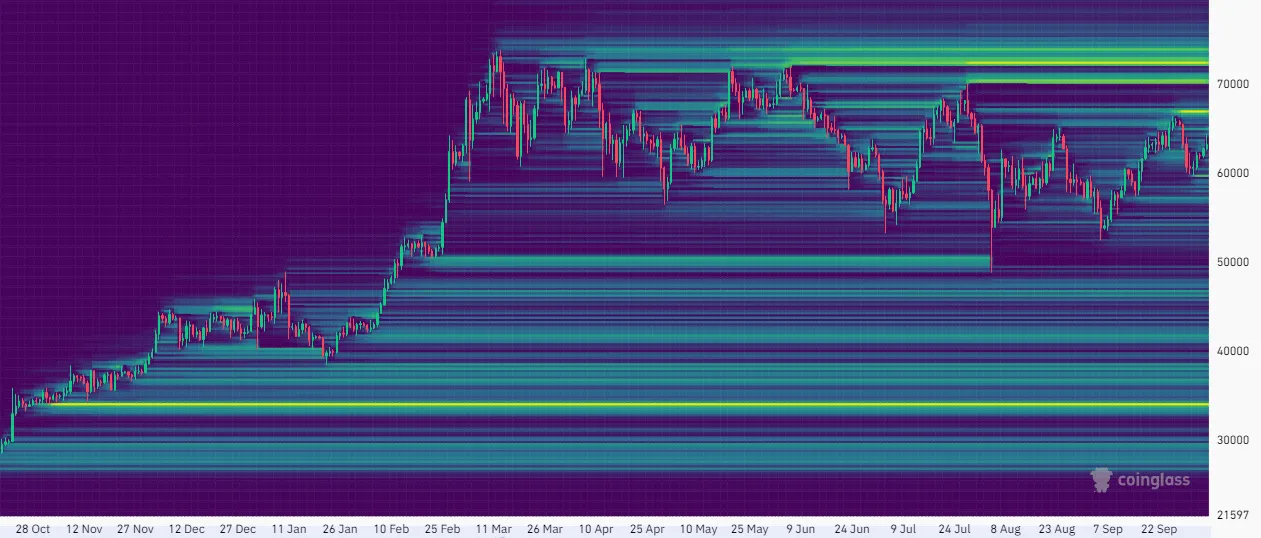
Coinglass Heatmap
The heatmap is a chart that shows just how degenerate the bulls and the bears are being in the current snapshot. So who's in the most trouble? Bears by a longshot. Those yellow lines are price points in which billions of dollars get liquidated. The above graph only accounts for orders on Binance. Multiply this a couple times over to include other exchanges.
Meanwhile the liquidations for the longs is well under the $50k mark, with the biggest long-squeeze sitting around $34k. We aren't going that low unless it's a one-off COVID level event... and even if that happens we all know how that turned out... just re-leverage the bottom for free money.
What else do we see?
This entire area within the yellow box has been COMPLETELY WIPED OUT by the Japanese FUD dip. It's been over two months and traders still haven't gained the courage to go long with a liquidation in this area. If there was ever a time to go long this would be it. The chance we dip into this range again is greatly diminished by the utter lack of leverage that exists here. Highly unlikely that we go sub $50k now that Q3 is finally over. Only wildcard I see is the biggest banking crisis the world has ever seen.
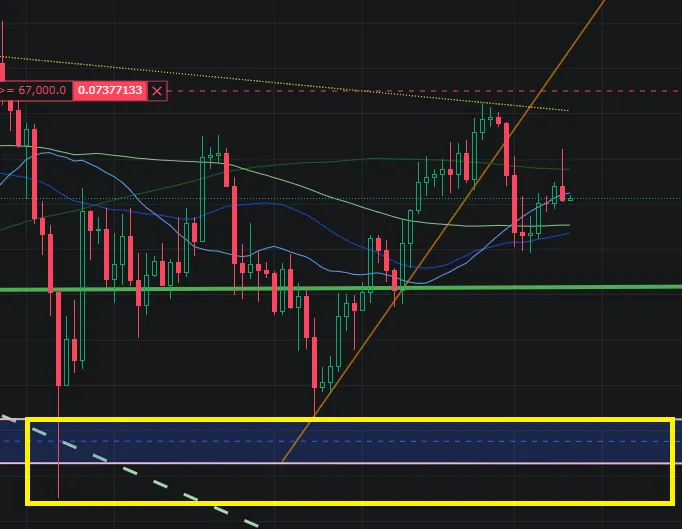
I personally have a long open and it's doing alright if not very stable. I've been checking up on it too much and needed to close my tabs so I don't continue getting distracted by it. the MA(25) has become a magnet for the current price while the 200-day average slapped us down pretty good yesterday.
It's good to point out we still have a full week of the MA(25) moving in an upward direction as all those low numbers (sub $60k) continue to fall off the tail end. Price only has to move up a tiny bit or trade flat in order to guarantee the next golden-cross. At that point we could see a cascading liquidation event that rampages these short orders.
- The first huge liquidation is right around $67k.
- If that gets any momentum it runs into the next liquidation at $70k.
- If the $70k gets cracked price will very likely squeeze $72k.
This will automatically push the price to something like $74k-$75k before it can finally chill and come back down a little. If this sounds far fetched to anyone this is only a 20% pamp. Those things happen all the time. Send the god-candle.
Of course there's no guarantee that this market has any chill whatsoever and it could still have upward momentum from there, but a reasonable trader would assume a cool-off period if this were to all play out over a couple of days.
Trading in between all moving averages.
My experience with a tight band of moving averages is that where we are trading right now is an extremely stable base. Pretty much every single line is parallel and moving perfectly sideways with the crab right now... and I'm not sure if I've ever seen this before in the entire history of BTC. Even the bottom of 2022 at $16k didn't look this good. We are trading right in the middle of all of it, thus this narrow band will continue to tighten and create and even more stable baseline.
Many have become very impatient with these moves due to six months of crab, but the current situation we are in is extremely solid; maybe the most solid I've ever seen since I began my crypto journey in 2017. Moments like this don't last for long. Something crazy always happens when the market makers realize we made it out to the other side of the tunnel.
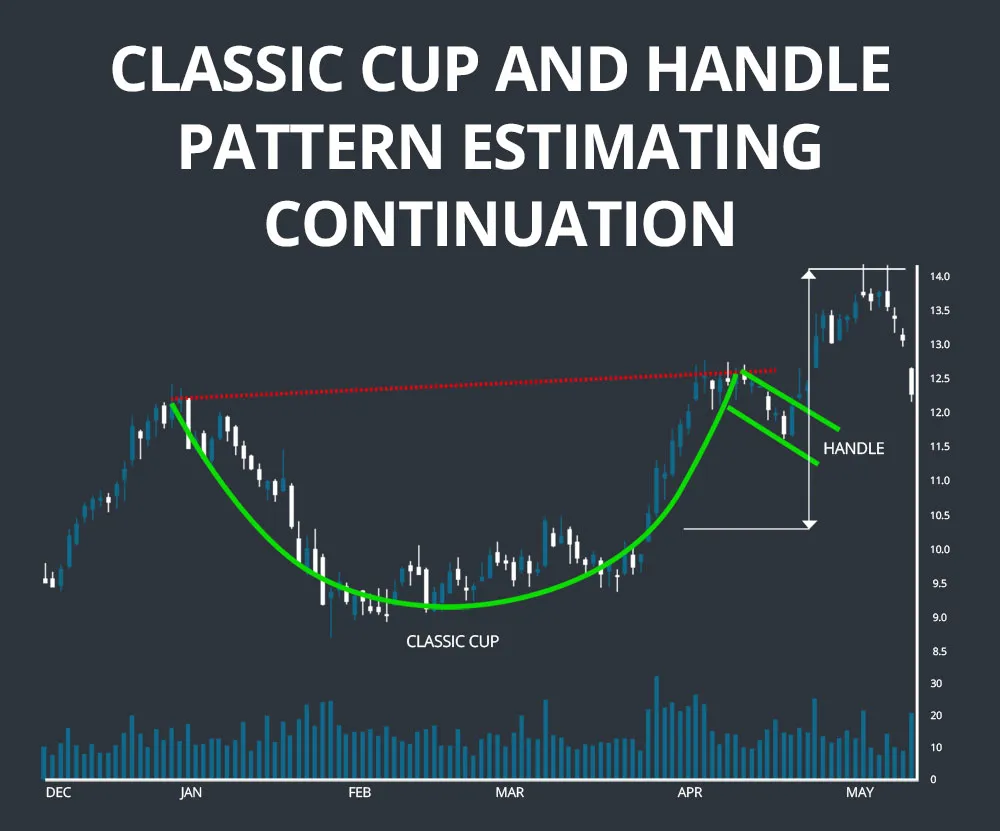
Notice the time axis for classic cup and handle is a few months?
Bitcoin has been printing a 3 year cup and handle into the 2025 bull market year. It's amazing how this vampiric specter of commerce has been able to demoralize everyone like it has over this time. Even in 2023 when it was pretty much only up everyone was complaining.
The only time that he's satisfied is when he's on a trump.

There are a couple other technical that scream bullish indicators as well.
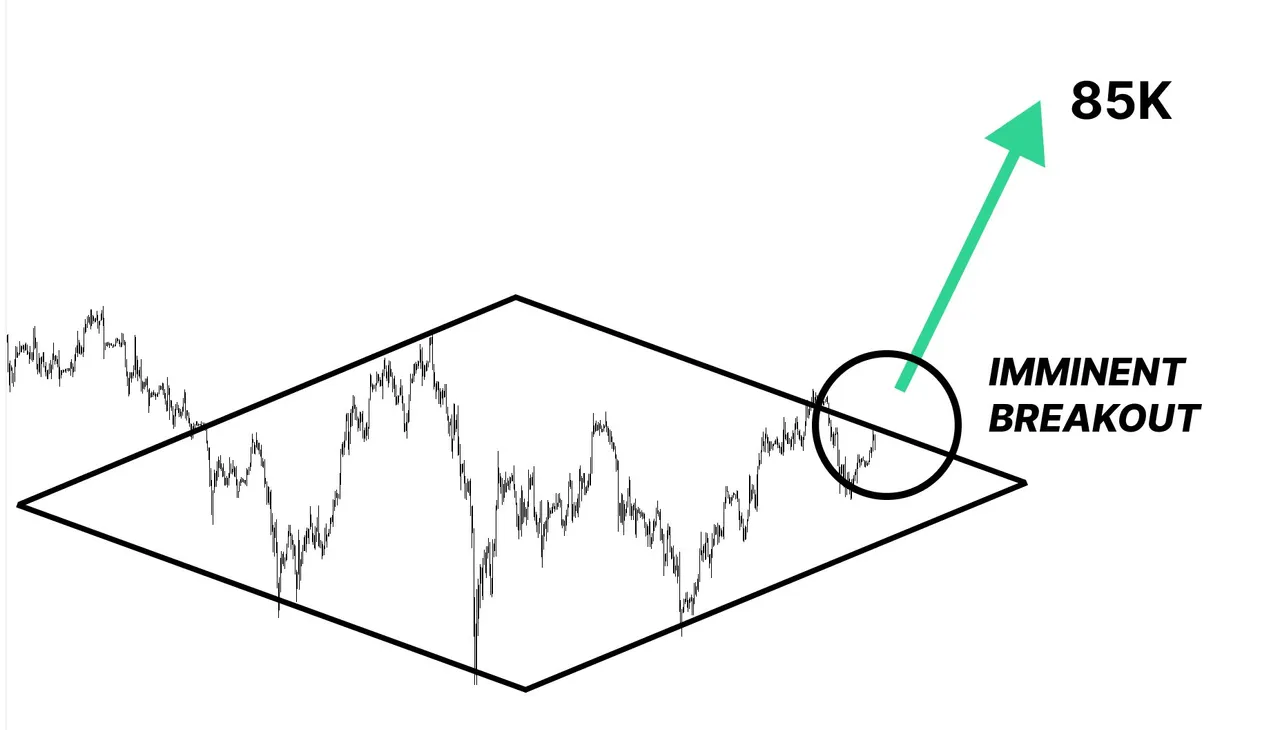
This is the first time I've seen this diamond pattern.
Seems legit because it totally confirms my bias.
Conclusion
Bears are going to get absolutely wrecked just like they always do nine out of ten times. There are short-squeezes everywhere, and be sure to remember that even if a position doesn't get forced into liquidation ALL of these people have to buy Bitcoin to pay back the loans they took. A liquidation may force that buyback immediately, but they owe that money back to BTC no matter what.
The heatmap is an important tool that honestly I should be looking at more often. It's pretty awesome that we all get access to this type of information... although I wonder just how much damage Wall Street is going to do when they jump on the scene taking the biggest swings we've ever seen within the industry. Should be fun. Until then keep stacking.