Hola feliz fin de semana hoy vamos a dar parte de lo que inicié hace 3 días atrás, hoy vamos con patrones de señal en formar W mañana si no hay nada relevante en el mercado cripto hablaremos del patrón M. Uno diferente al otro uno es al alza o cambio de tendencia y el otro es a la baja continuación del mercado bajista.
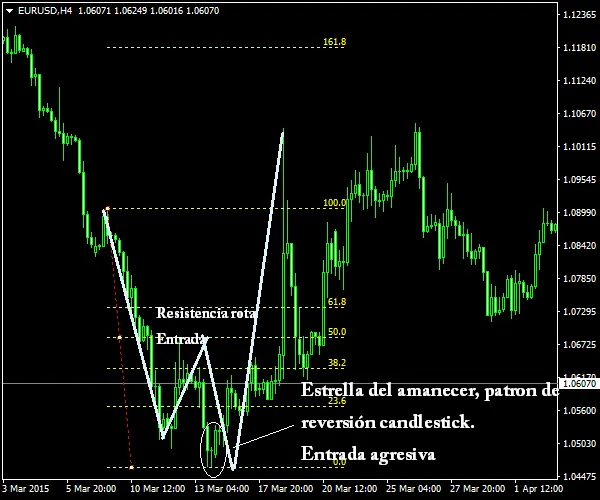
El patrón de referencia W crea un mapa entero del proceso de reversión del suelo o de un fondo (mínimos alcanzados por el precio). Esta señal identifica los pivotes claves y proporciona señales de alerta temprana. El patrón comienza en su último máximo del precio, justo antes del primer fondo. El primer rebote después de este mínimo marca el centro de la W ya que retrae entre 38% y 62% de su último movimiento bajista.
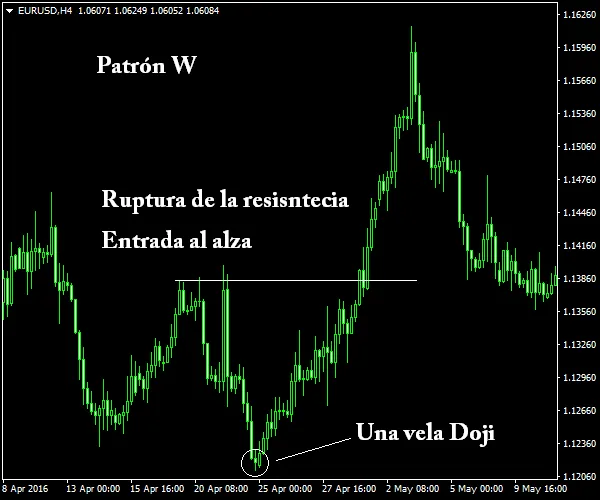
Luego se tiene que espera otra pierna alcista. El precio en este nivel tiene una alta probabilidad de moverse aún más alto. Puede recorrer fácilmente 100% del impulso original bajista, completando tanto el doble fondo como el patrón W. Esta tendencia podría permite una entrada adicional cuando el precio retrocede al pivote central después de la ruptura.
Como lo explica la gráfica siempre debemos de estar atentos, a nuestras herramientas de trabajo y las indicaciones que. Nos van dando en cada temperalidades. Así podemos tener mejor beneficios en cada operación que hagos o en cada análisis que realezamos para hacer nuestro trade del día.
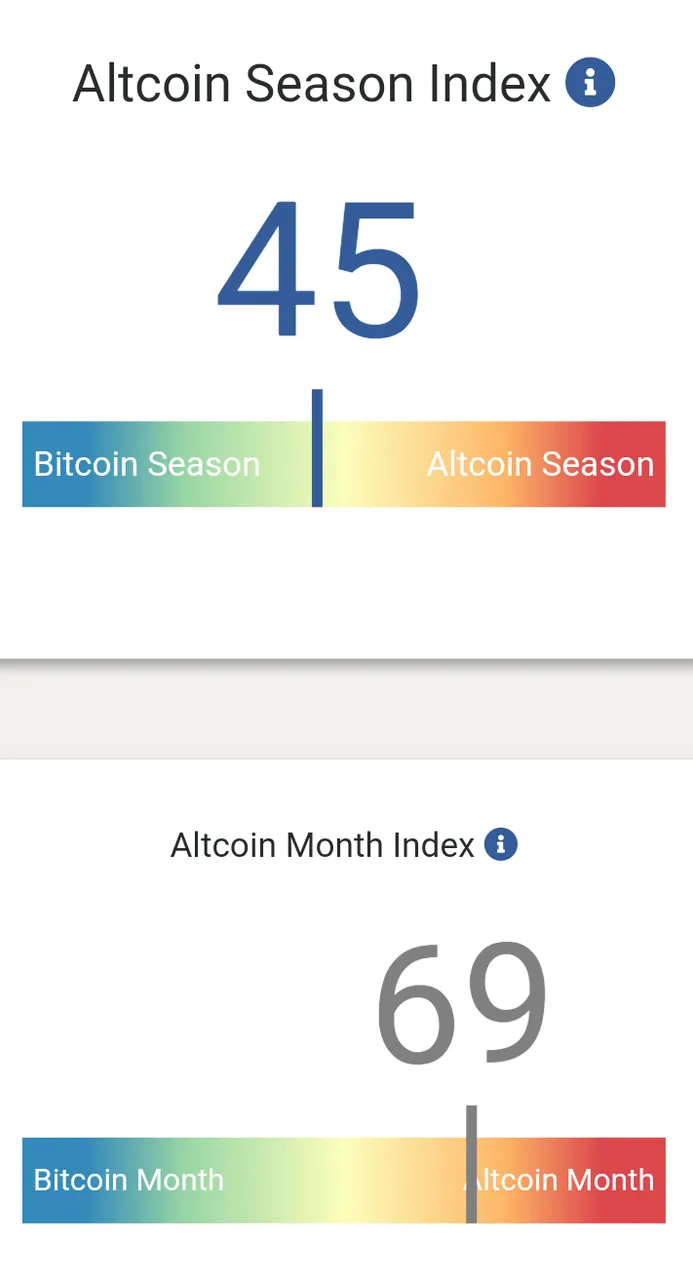
Hace 6 días cuando me inicie aquí en la plataforma, les mostré este termómetro de cuanto nos falta para tener un mes de altcoins. Y estaba entre 45 y 51. Días después esta en 69 ya casi en 75 % para llegar al mes de las altcoins y el diario está en 45 % cuando estaba entre 25 y 31 ya hoy esta en 45% solo falta poco para que tengamos a las primeras 100 monedas en sus máximos históricos. O incluso superando los como lo tuvimos en el 2017 yo me mantengo alsista solo veremos caer de nuevo al btc un poco más a los 24 k o 25k y volveremos hacia arriba con más impulso.
English
Hello happy weekend today we are going to give part of what I started 3 days ago, today we are going with signal patterns in form W tomorrow if there is nothing relevant in crypto market we will talk about M pattern. One different from the other one is bullish or trend reversal and the other is bearish continuation of the bear market.
The W reference pattern creates an entire map of the reversal process from the floor or a bottom (lows reached by the price). This signal identifies key pivots and provides early warning signals. The pattern starts at its last price high, just before the first bottom. The first bounce after this low marks the centre of the W as it retraces between 38% and 62% of its last downward move.
Then another bullish leg has to be expected. The price at this level has a high probability to move even higher. It can easily retrace 100% of the original bearish momentum, completing both the double bottom and the W pattern. This trend could allow for an additional entry when the price retraces to the central pivot after the breakout.
As the chart explains we must always be attentive, to our tools of work and the indications that. They are giving us in each temperalities. This way we can have better profits in each operation that we do or in each analysis that we do to make our trade of the day.
6 days ago when I first started here on the platform, I showed you this thermometer of how far we are from having a month of altcoins. And it was between 45 and 51. Days later it is at 69 and almost 75% to reach the month of altcoins and the daily is at 45% when it was between 25 and 31 and today is at 45% only a short time until we have the first 100 coins at their record highs. Or even surpassing them as we had in 2017 I remain alsist I will only see the btc fall again a little more to 24k or 25k and we will return upwards with more momentum.
Translated with www.DeepL.com/Translator (free version)