It's the third day of August already, we have the monthly close, so we can have a proper look at what $HIVE and $BTC has been doing.
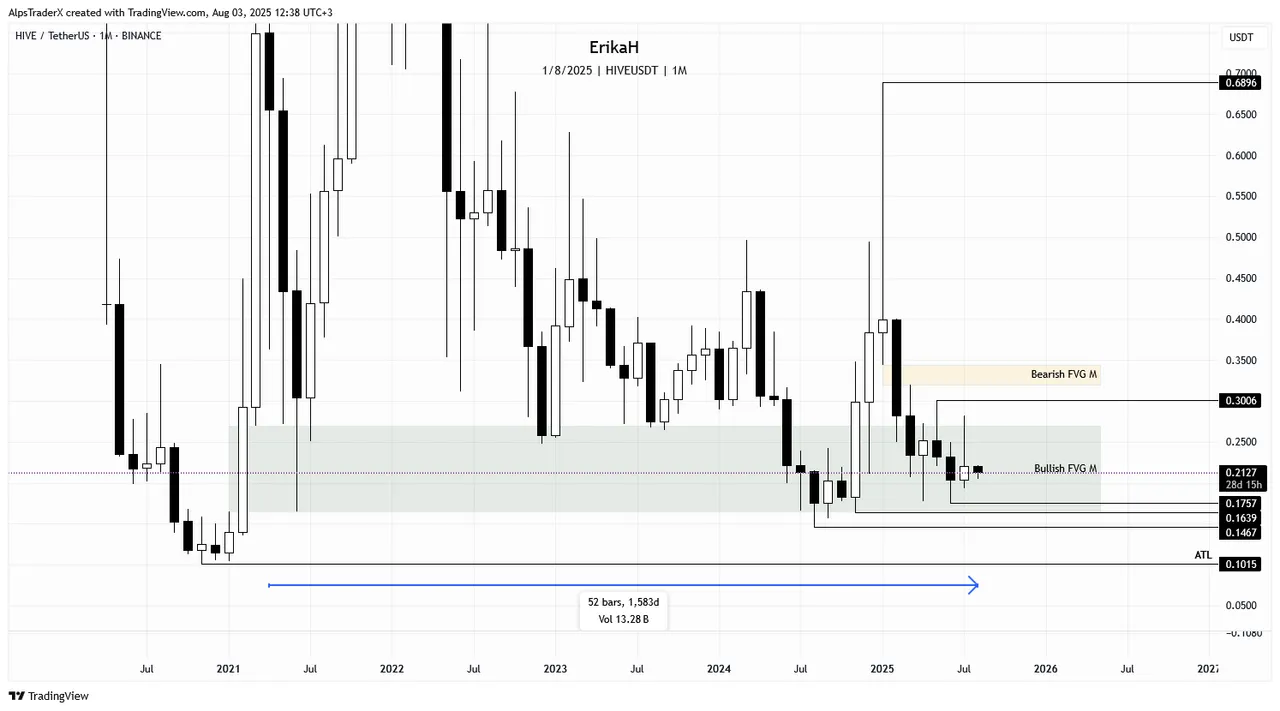
The monthly candle closed on Tuesday and we got a bullish candle, with a long upside wick (or shadow if you like), which means selling pressure was too high to keep price higher, or there was not enough buying pressure. Same meaning, expressed in a different way, kinda like "half full or half empty glass". Since the candle close, we have experienced a downside move in the market, which obviously has affected $HIVE too.
It's pointless to speculate now on the monthly candle as there are still 4 weeks to go till the candle close, but in general, everything I've said before is still valid. Price is still inside the bullish gap, which has been holding price captive for 52 months now, which means 1583 days. The immediate high to sweep I'm looking at is $0.3006 and the low in case we see more weakness is $0.1757, which is the swing low now.
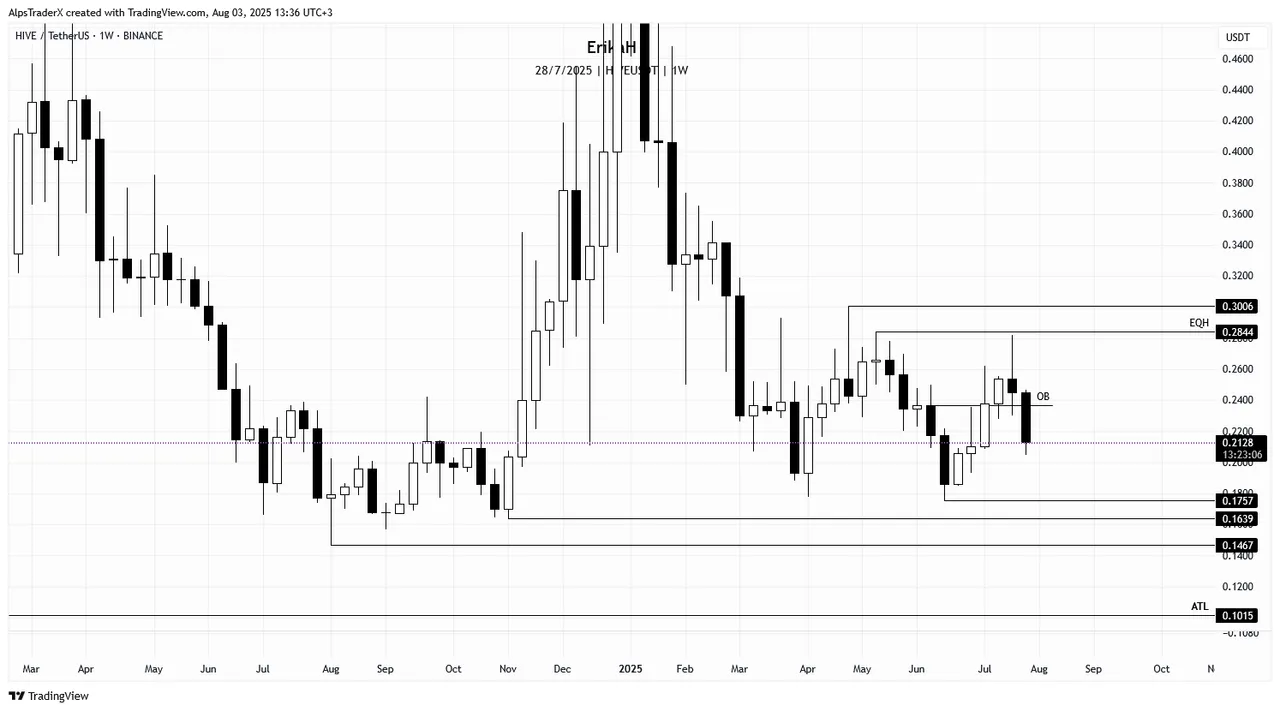
On the weekly time frame, price retested the weekly order block (OB) and it is above it. There are 14 hours to go till the candle close, but it looks like we're going to get a bearish candle with a big body this week. If this week's candle closes, it will confirm a lower high and $0.2821 as the new swing high, which is lower than the previous one, obviously.
At the time of writing, price is below mid-range. In case of more weakness, I'm looking at $0.1757 as swing low and on the upside, we have the EQH at $0.2844 and the obvious swing high at $0.3006.
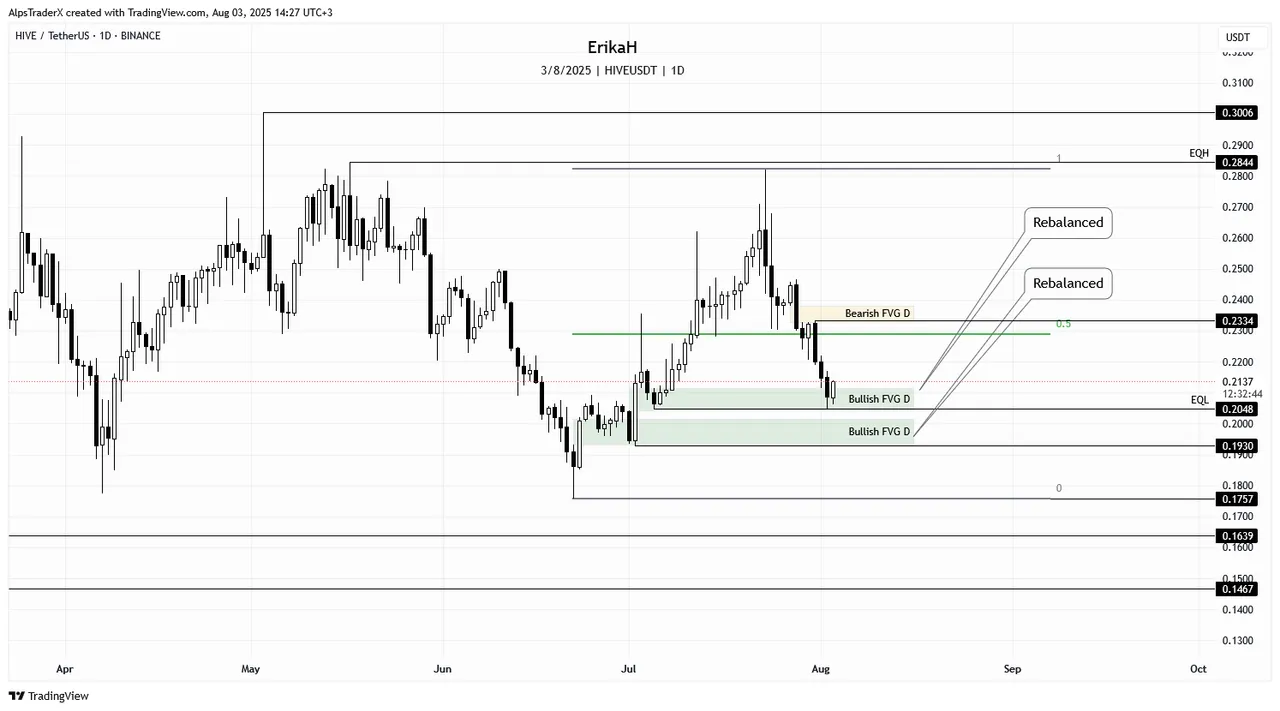
On the daily time frame, price is below mid-range, at a crucial level. Bounced from the bullish fair value gap (FVG), that has been fully rebalanced prior already and still holding price. So far it seems the gap is holding price but it's Sunday and as they say, "Sunday pump, Monday dump", so we'll see what happens tomorrow, when traditional markets open. In case of a bounce here, the next level on the upside is the intermediate term high at $0.2334, which is inside a bearish gap, which means resistance.
In case this gap can't hold price, there's another one below, which has also been retested and rebalanced at the beginning of last month and should defend price. In case we get there, the low to sweep is $0.193 and if there's more weakness, then I'm looking at $0.1757.
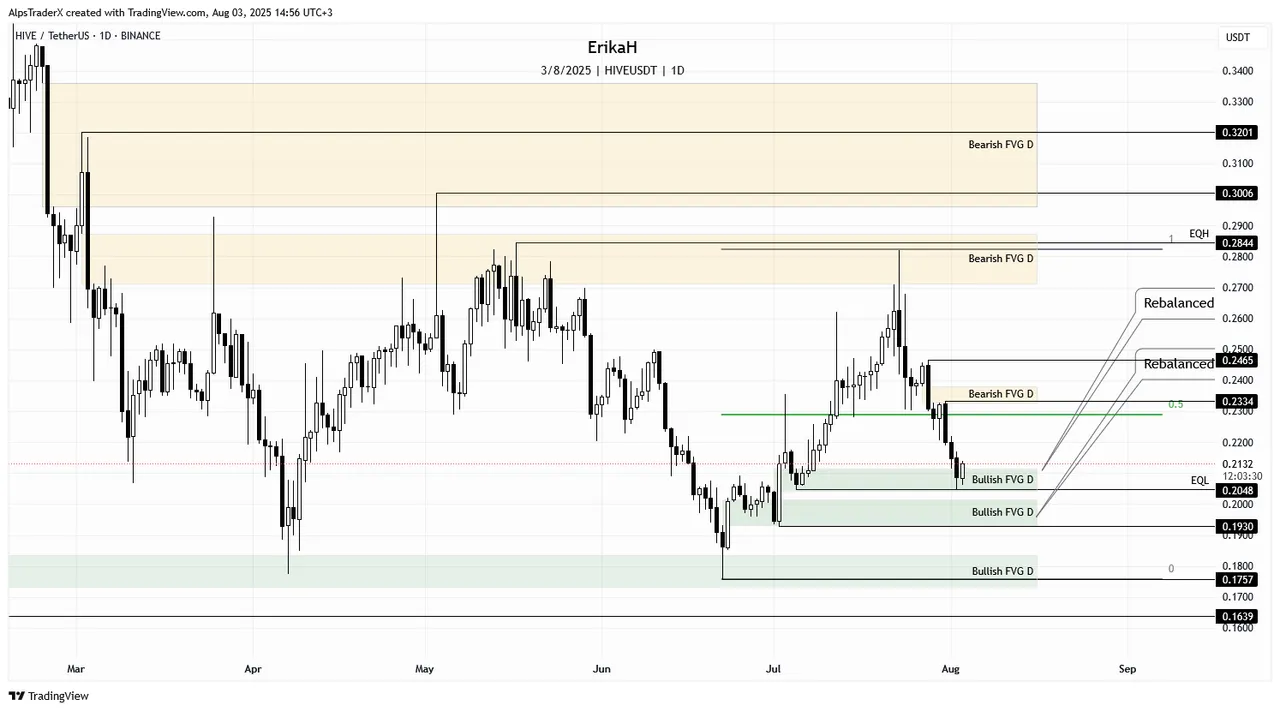
Here's a complete "picture", which all the gaps and levels to watch, for those who can read the chart. I didn't want to start with this as it can be stressful and confusing.
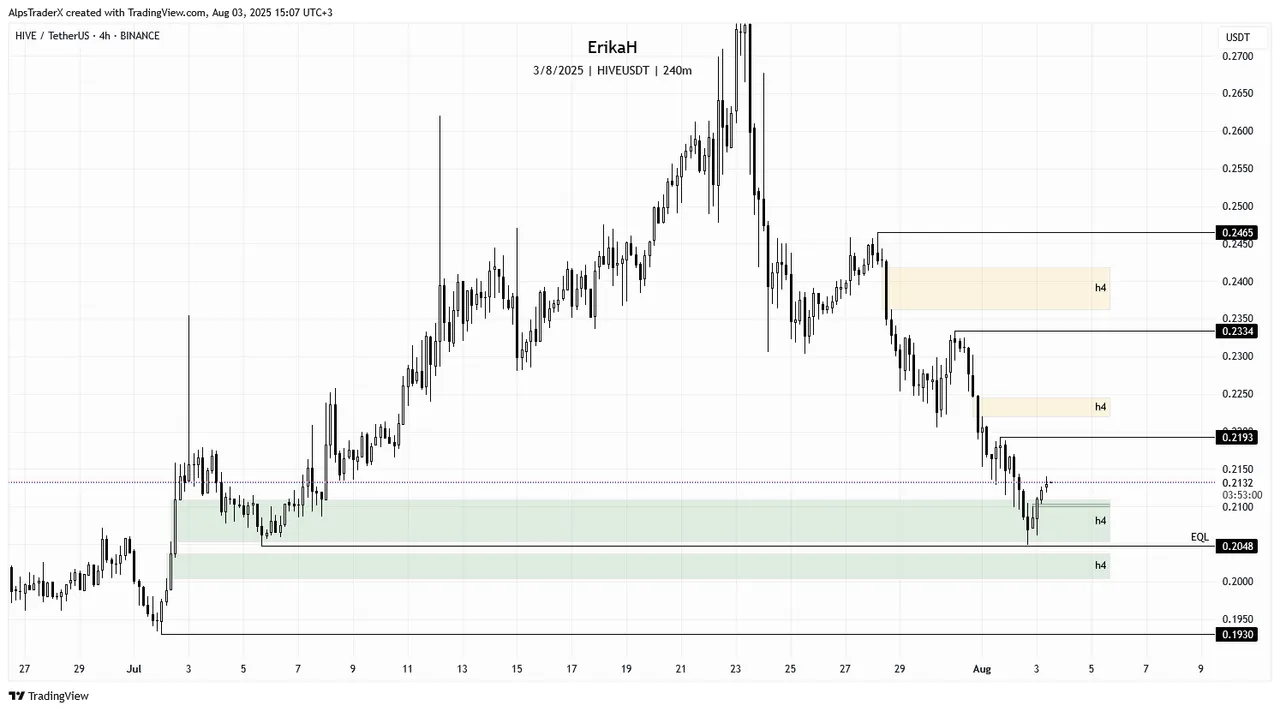
On a more granular scale, on the h4 chart price bounced off the bullish gap, but did not sweep the low at $0.2048. At the time of writing, it seems like $HIVE lost momentum and it seems the market is undecided. There's a slim gap on the leg up, barely visible, I don't think it has much significance, so at this point sweeping $0.2048 is highly possible in my opinion. If that level can't hold price and we don't get a bounce there, there's still chance for the gap below to defend price. If not, then $0.193 is next.
In case of a healthy momentum, levels to watch on the upside are $0.2193, after which we have a bearish gap (marked with yellow on my chart), which means resistance. If price manages to invert the gap and hold above it, $0.2334 is next, then another bearish gap and $0.2465.
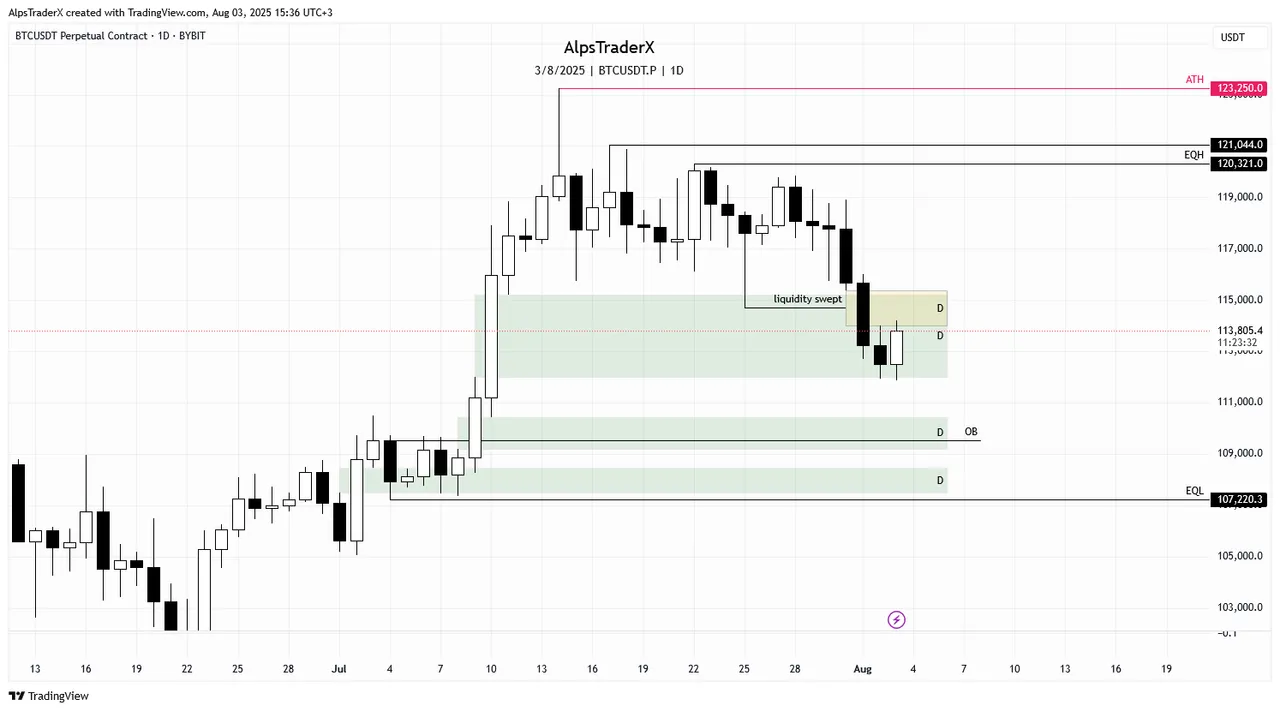
$BTC is also at a crucial level. Price is inside the daily bullish gap, heading into resistance, which is the bearish gap, marked with yellow on the chart. This level must hold, if we want bullish continuation.
There's another bullish gap below the current one, which has not been retested yet, so if this level doesn't hold, we could see price dip into the gap next week, maybe retest the OB as well.
The third gap has been rebalanced and has held price at the beginning of July. We'll see what happens next week.
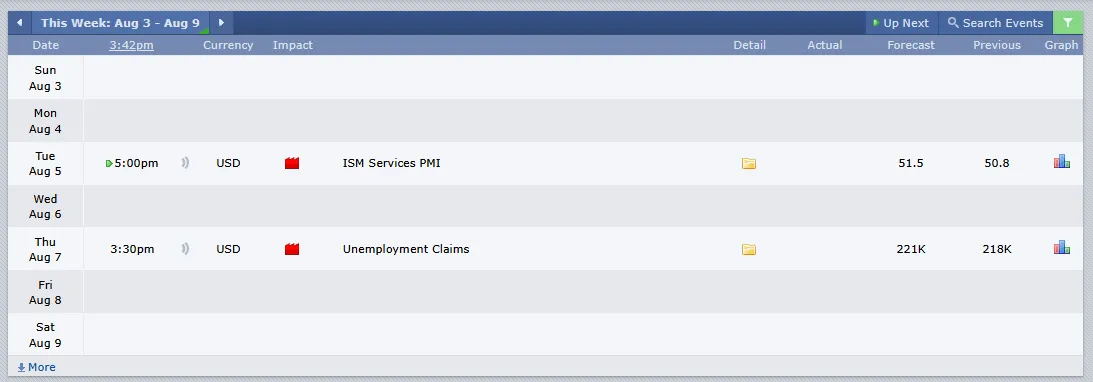
Next week we're going to have 2 red folder days, so volatility is not going to be much, but only in theory as we never know what's going to happen.
Remember, technical analysis is not about forecasting price, but about reacting to what price does.
As always, this is a game of probabilities, not certainties. Also please note, this is not financial advice, it's my view and understanding of the market.
All charts posted here are screenshots from Tradinview.
Come trade with me on Bybit.

If you're a newbie, you may want to check out these guides:
- Communities Explained - Newbie Guide
- Cross Posting And Reposting Explained, Using PeakD
- Hive Is Not For Me
- How To Pump Your Reputation Fast - Newbie Guide
- Tips And Tricks & Useful Hive Tools For Newbies
- More Useful Tools On Hive - Newbie Guide
- Community List And Why It Is Important To Post In The Right Community
- Witnesses And Proposals Explained - Newbie Guide
- To Stake, Or Not To Stake - Newbie Guide
- Tags And Tagging - Newbie Guide
- Newbie Expectations And Reality
- About Dust Vote And Hive Reward Pool, by libertycrypto27