We are after 3 weeks of almost vertical movement for bitcoin facing 100k next week, again. Pulled back a little over the week-end, but the perspective of pushing through 100k remains close enough.
It will be interesting to see what will happen next week.
There are these possibilities, in my opinion:
- a small dip to 88-90k (9-13%) then push back toward 100k
- continue the march toward 100k and pass it by a bit (either symbolically or something like 117k), then correct to below 100k
- pass the 100k threshold and keep going strongly ahead (possibly to something like 135-140k before a big correction, to remain above 100k after it)
- attempt to pass 100k again, fail, then correct
- a big correction to 77k or 74k (30-35%)
I don't think the market is in the mood for a big correction, unless it gets rejected hard or multiple times at 100k. A small dip (other than what we had this week-end) risks bringing the chart into a H&S logic. To me, the most likely seem 4, 2, and 3.
I compared the time length of a few vertical movements bitcoin had in the previous cycle with this one. They were up to 2 months in length before a major correction, but the longest wasn't as vertical as we had the passed 3 weeks.
This is the logarithmic chart of bitcoin with the periods I looked at marked with purple bars:
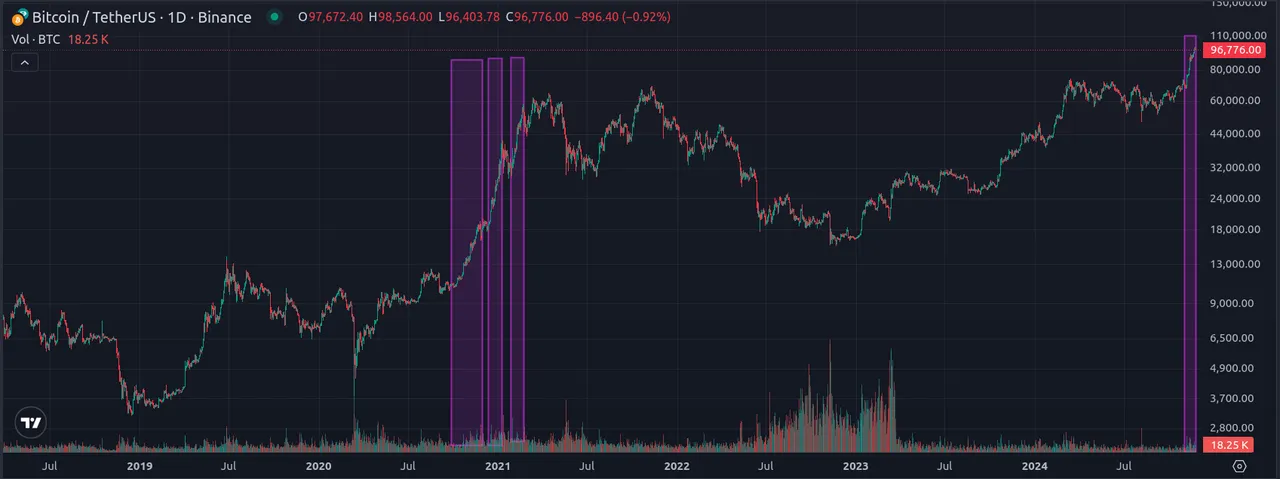
From the timing perspective, it is possible to have some fights between bulls and bears / profit takers around the 100k mark, with bulls eventually winning and going higher until something like mid December (or even Christmas) before a major correction. That would be consistent what happened on other occasions in December. This is all speculation, of course.
Next week I'm thinking 100k will be tested again. We will see if successful or not.