Correlation analysis determines the nature of relationship that exist between variables of concern which in our case is the price of LEO and POLYCUB.
The result can either be positive, negative or zero.
When it’s positive indicates that as the price of POLYCUB is in a bull market, that of LEO will be same and vice versa. This relationship is closer to +1 axis.
When it’s negative indicates that as the price of POLYCUB is in a bull market, that of LEO will be bearish and vice versa. This relationship is closer to -1 axis.
When it is zero indicates no relationship at all. This type of relationship is closer to 0 axis.
The relationship can be weak or strong depending on how close it is to each axis.
I shall analyze the price of LEO and POLYCUB relationship using SPSS.
Result Of Analysis
The result of correlation analysis shows a weak negative correlation with a coefficient of –0.046.
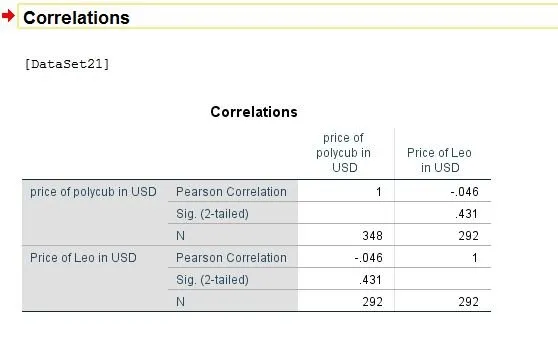
This relationship is negative and weak and hence tends towards to zero axis. This indicates that as the price of POLYCUB goes high It has little significance in the price of LEO pump or dump.
Furthermore it can be explained better from the scatterdot diagram.
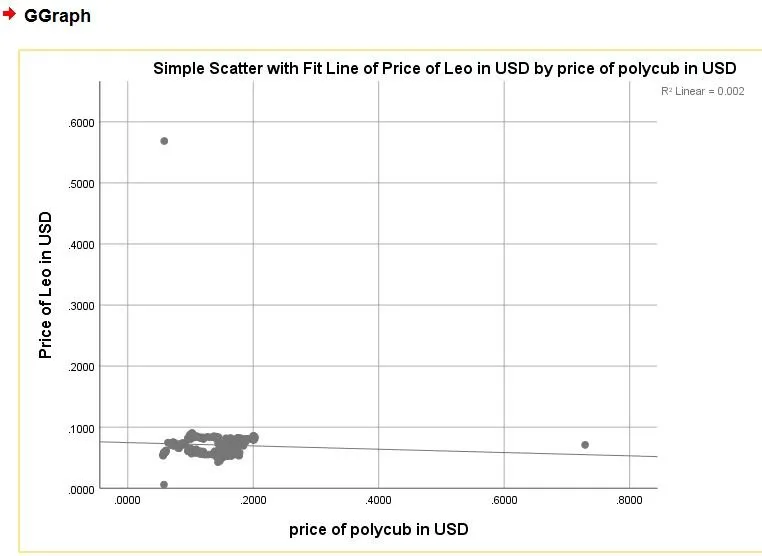
When there is a diagonal line running from the middle of the intersection point, of both axis, a positive relationship can be visualized but when there is a line running from the end of one axis to the other end shows a negative correlation.
Conclusion
In a nutshell, we can conclude that there is a very little and weak type of negative relationship between POLYCUB price and price of LEO because it is closer to the 0 axis.
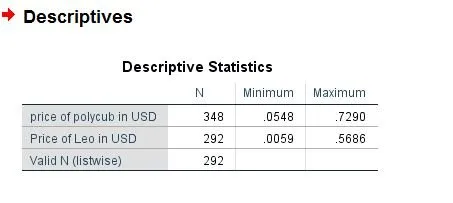
Other images includes
Maximum and minimum prices of both assets from June 4 – September 27,2022.
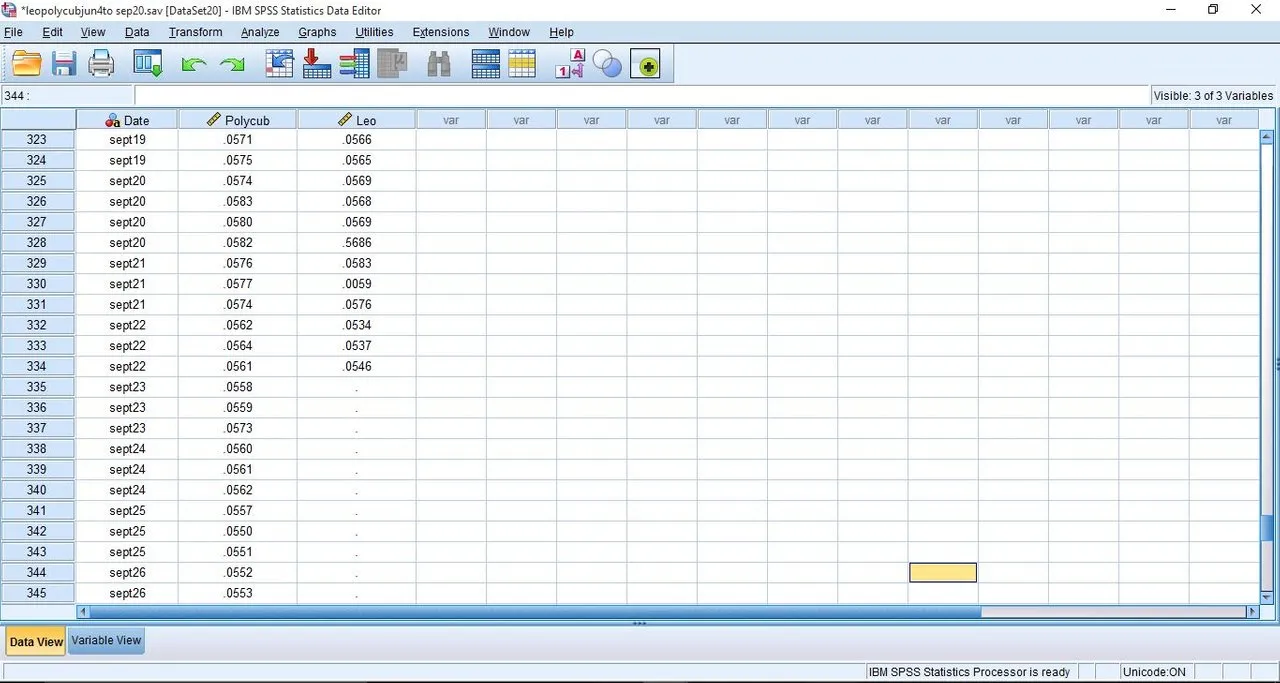
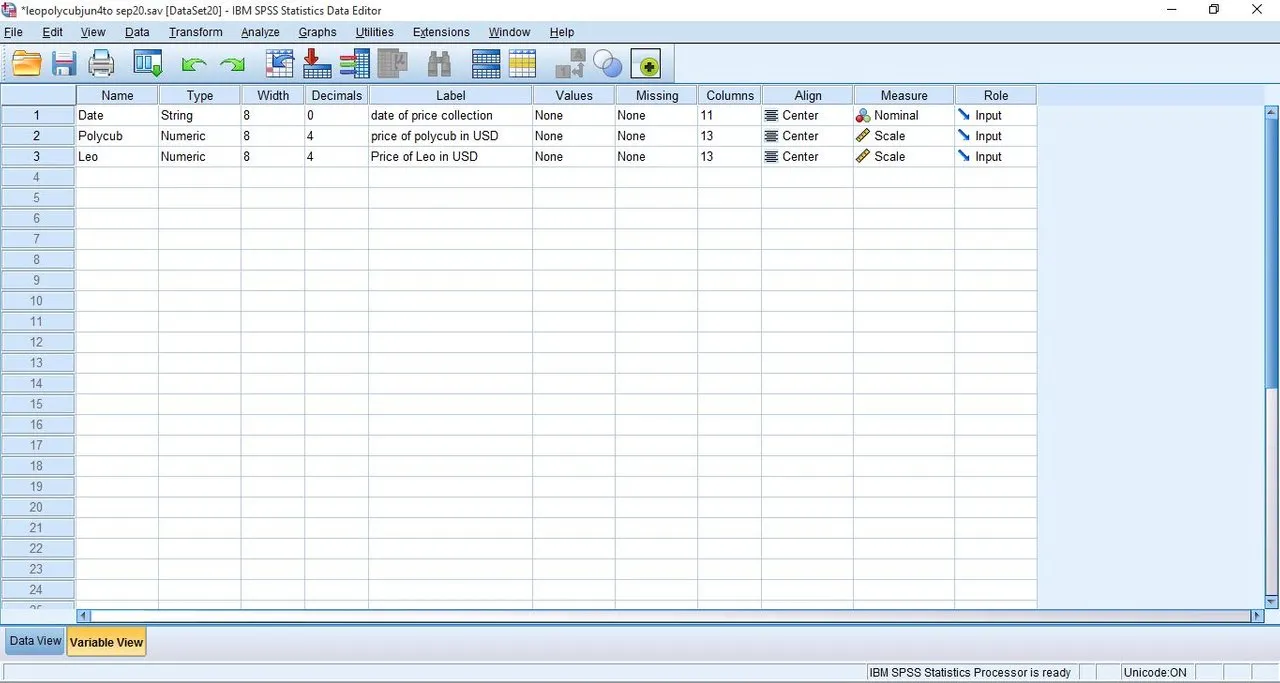
Data view mode
Variable view mode
Thanks for reading, please can @forexbrokr evaluate the format of this work? Thanks to him for efforts of presenting analysis result.
Thanks for reading.