The importance of statistical analysis of crypto data cannot be over emphasized. This article will analyze the type and strength of relationship of relationship that occurs between AVAX and LEO under the following sub titles.
Correlation result
From the result of correlation below, the column and row that intersects price of AVAX and LEO reads that the coefficient of correlation is 0.867.
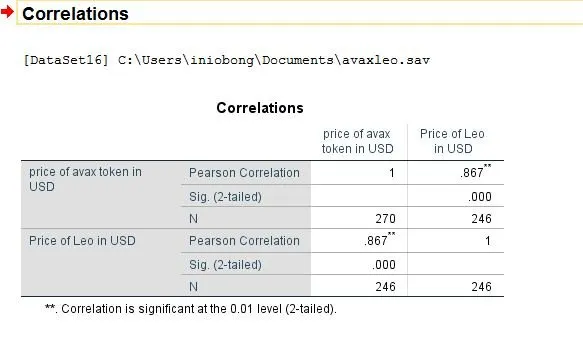
This value shows a positive and strong correlation between both assets.
When a relationship is positive, the more increase in price of AVAX can influence the increase in price of LEO and vice versa at same rate according to their levels.
Scatter dot
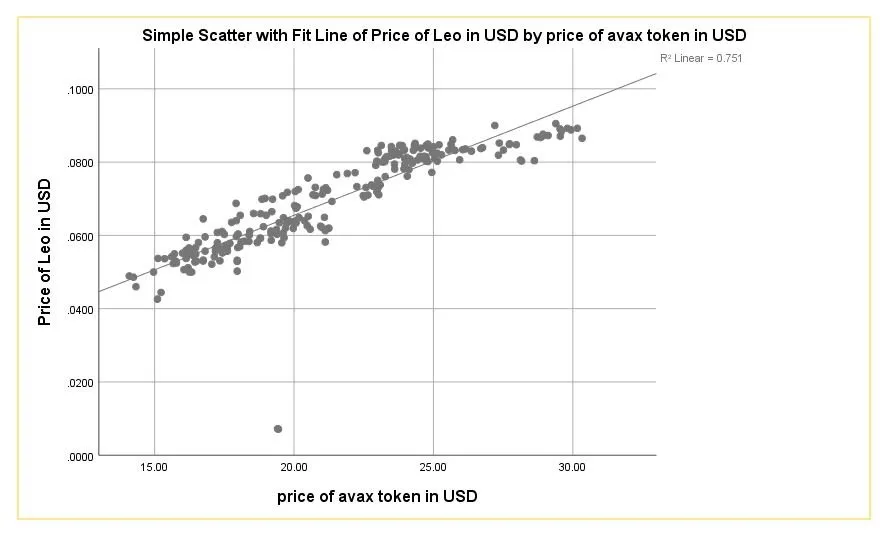
The scatter dot explains more of the correlation between both assets. Having the scatter dot with independent variable as price of AVAX and its dependent variable as price of LEO, it can be seen AVAX is traceable to determine price of LEO.
Box plot of AVAX price
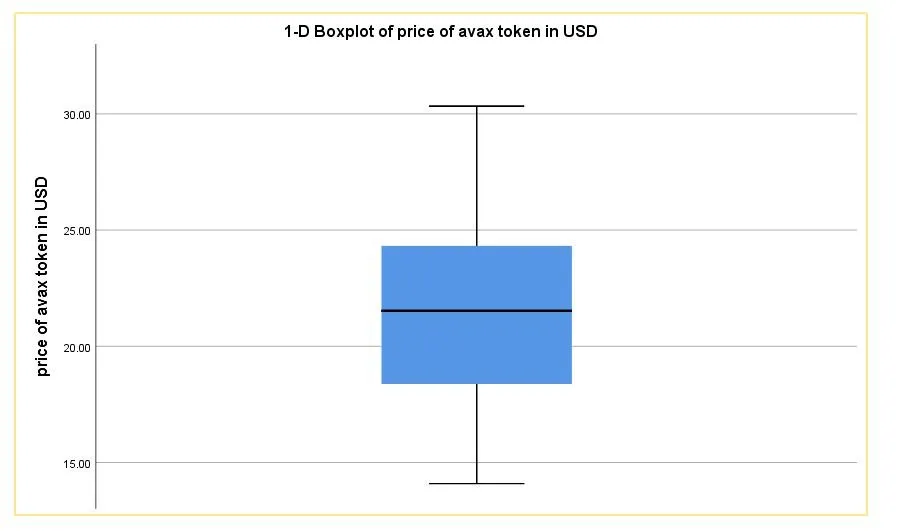
The box plot shows the price range of crypto asset in a pictorial view within a specified period of time. The box plot of AVAX can be seen below.
Box plot of LEO price
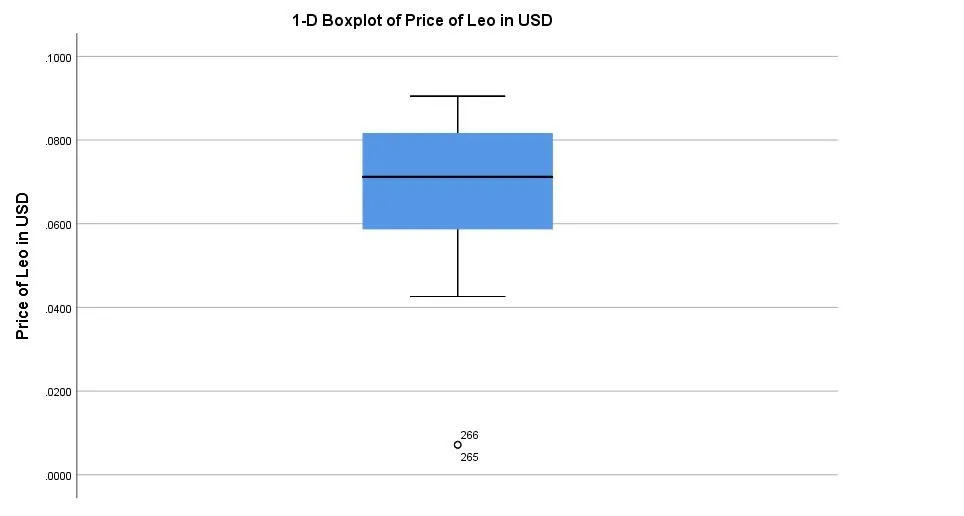
The box plot of LEO price can be seen below. It shows the maximum and minimum value of LEO within the stated specified period in the title.
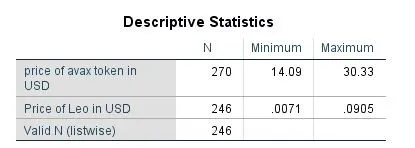
Maximum And Minimum Values For Both Crypto Asset
The maximum and minimum values for AVAX and LEO prices of the specified period is seen below.
Other images includes
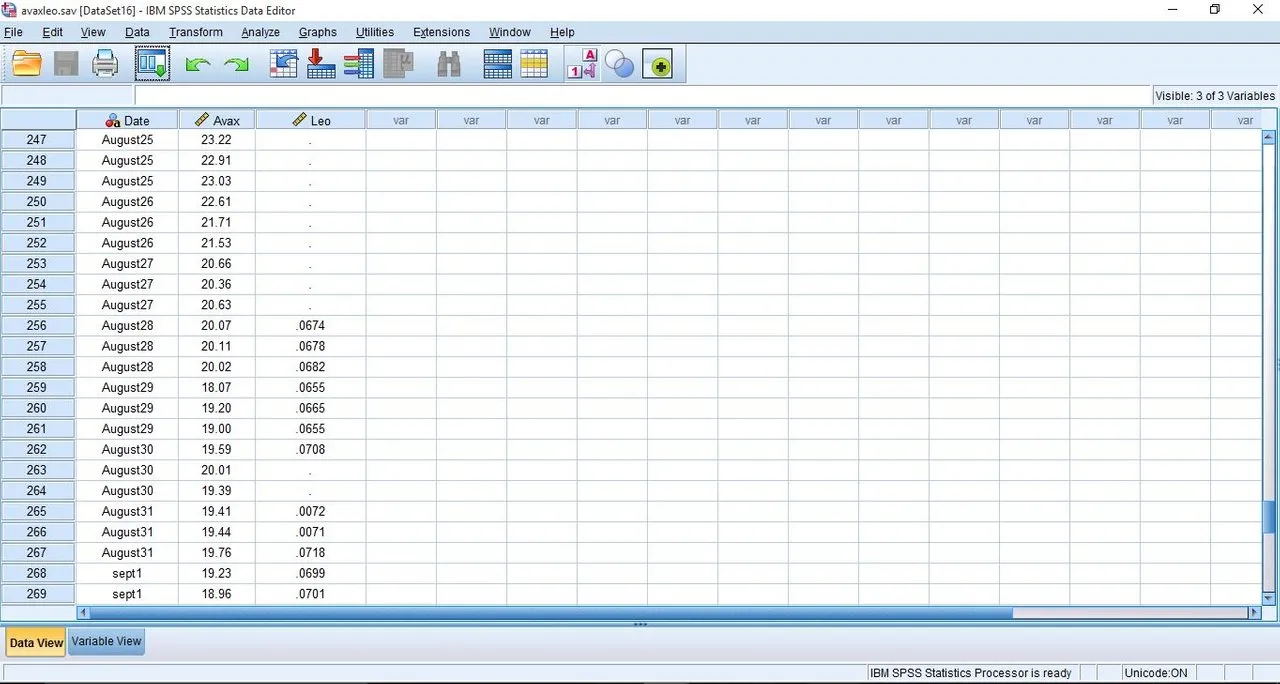
Data view
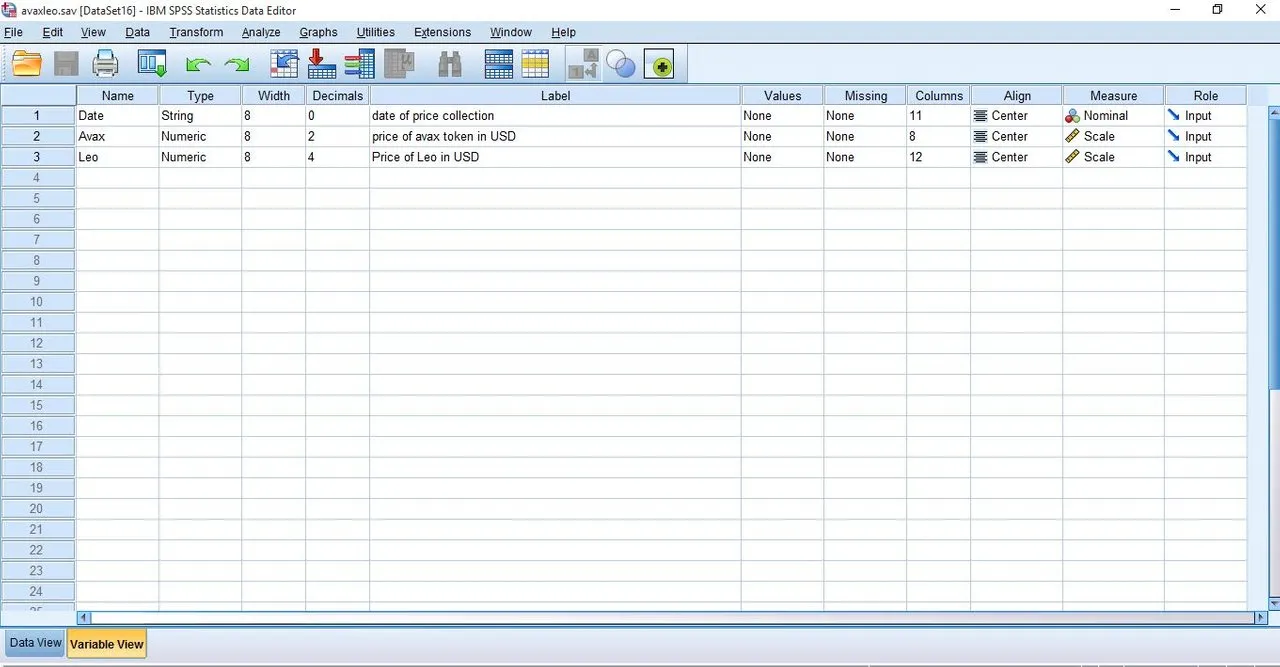
Variable view
Thanks for reading