Graphical representation of LEO price pictorially presents the performance of LEO within the previous four months period in 2022.
Price of LEO in June, 2022
The bar chart for the price of LEO in June is shown below.
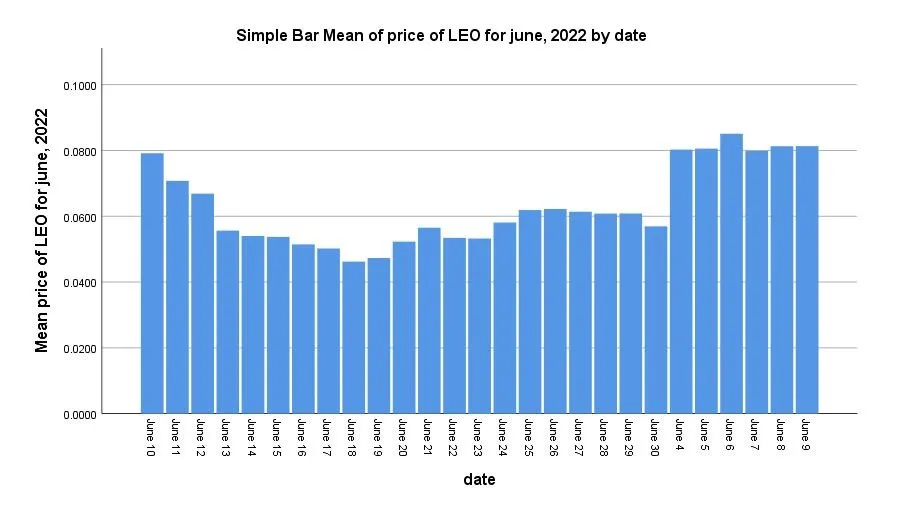
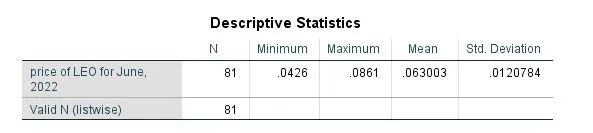
It includes the maximum, minimum and mean. It will compare the mean to the maximum price.
Price of LEO in July, 2022
The chart for the price of LEO in July is shown below.
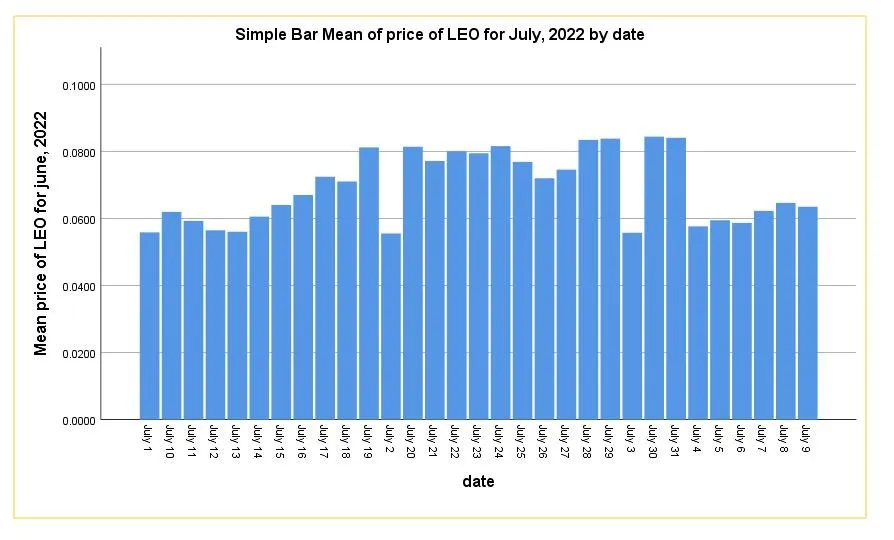
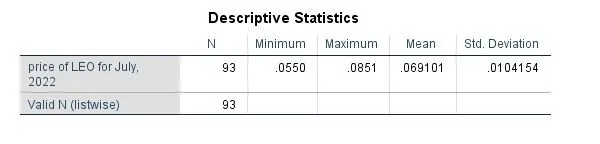
It also includes the maximum, minimum and mean.
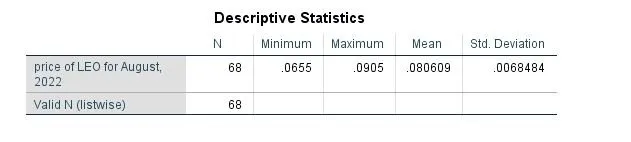
Price of LEO in August, 2022
The chart for LEO price in August can be seen below.
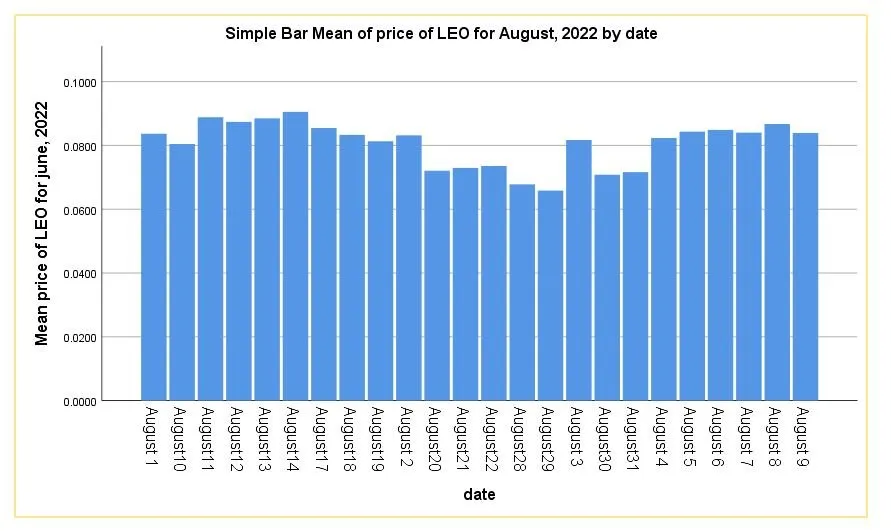
It also contains the table for minimum and maximum price.
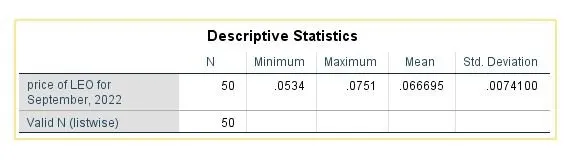
Price of LEO In September, 2022
The price of LEO in September is been presented in a bar chart below.
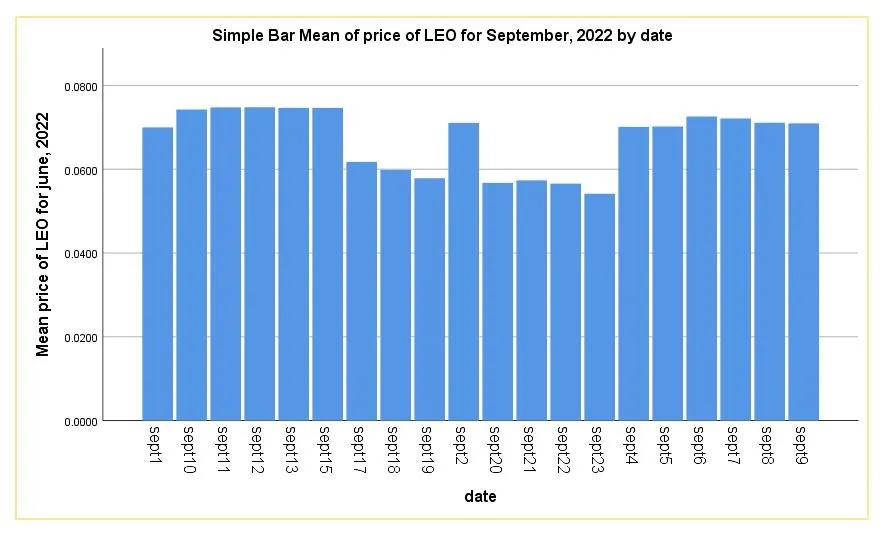
Also a table showing the price characteristics follows.
Comparing the Mean Price Of LEO from June – September, 2022.
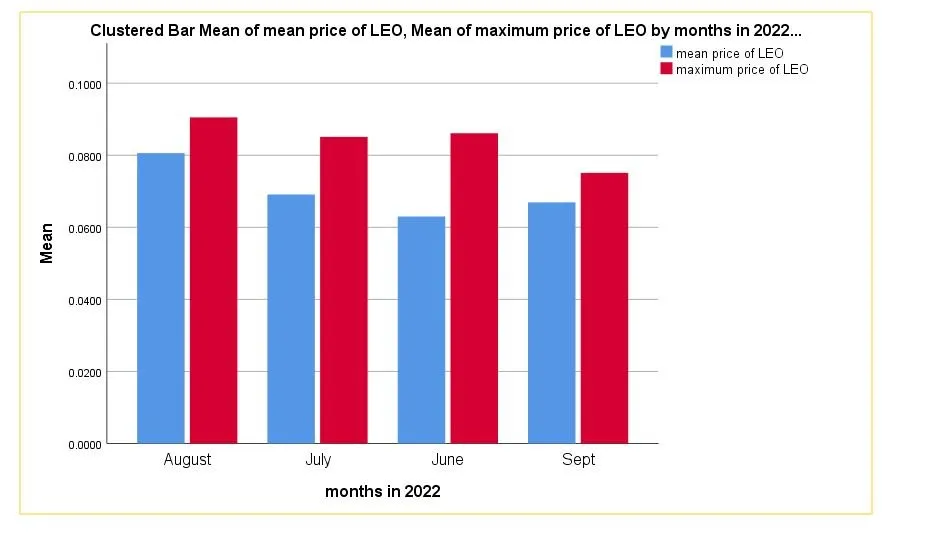
The average price of LEO was compared between the 4 months period. It indicates a good performance of LEO in terms of Price in the month of August. It has its maximum price with mean price as highest of $0.0806 as mean price and $0.0905 as its maximum price.
The least price of LEO can be seen as September, 2022 having a mean price of $0.0669 and $0.0751 as the maximum price.
It can be seen the price of LEO has been dropping in bits since from the month of August to September, 2022.
Thanks for reading.