Statistical analysis methods have proven to expose the information related to data. In this article, I will be using the price of HIVE to predict that of LEO price from data provided from July to September, 2022.
I shall consider this content under the following subheadings;
Model summary
Anova table
Coefficients table
Conclusion
Model summary table
From the model summary table, the first table shows the entry variable to predict for LEO price is the price of hive.
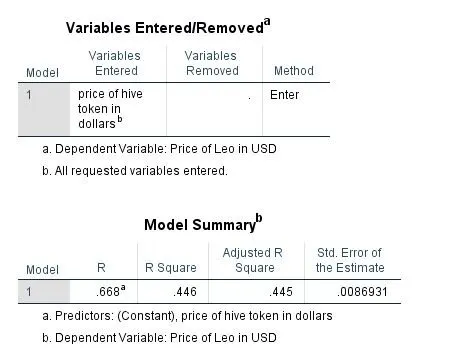
From the second table, it is visible that our adjusted R square present the model explains 4.4% of variance in LEO data (price).
Anova table
The anova table has its general belief that the price of LEO and HIVE analyzed doesn’t have any form of relationship.
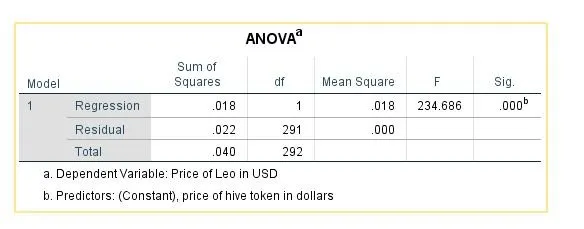
It can be seen in the significance column that the significance value is 0.00 less than the standard of 0.05. We can conclude there is a form of relationship between the price of HIVE and that of LEO.
Coefficients table
Coefficients table helps generate a model that will be used in predicting the price of LEO when the price of HIVE is known.
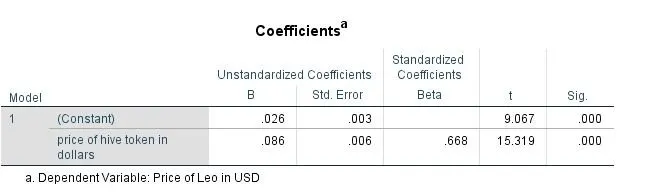
From the unstandardized B column represents the model which is given by;
Price of LEO = 0.026 + 0.086 * price of HIVE
We shall be testing for the price of LEO when the rice of HIVE is $0.5611
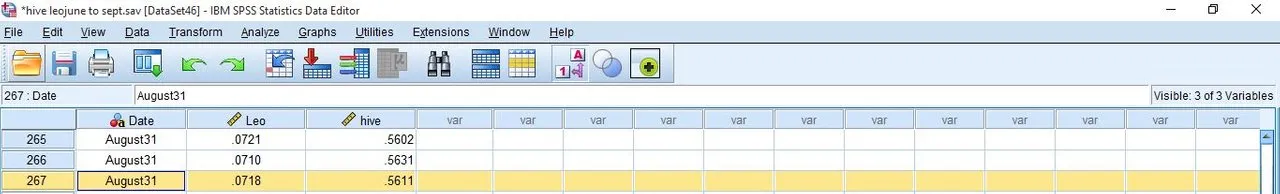
Price of LEO = 0.026 + 0.086 * price of HIVE
Price of LEO = 0.026 + 0.086 * 0.5611
Price of LEO = 0.026 + 0.0482
Price of LEO = $0.074
However comparing this to the entered value for price of LEO = $0.718
There seem to be a difference of $0.0022.
Conclusion
The price for LEO was been predicted with a model using SPSS software considering the previous price of each asset gotten from coin gecko. For the model to be applicable in future there needs be update of the price of both crypto asset.
Other Images
Boxplot
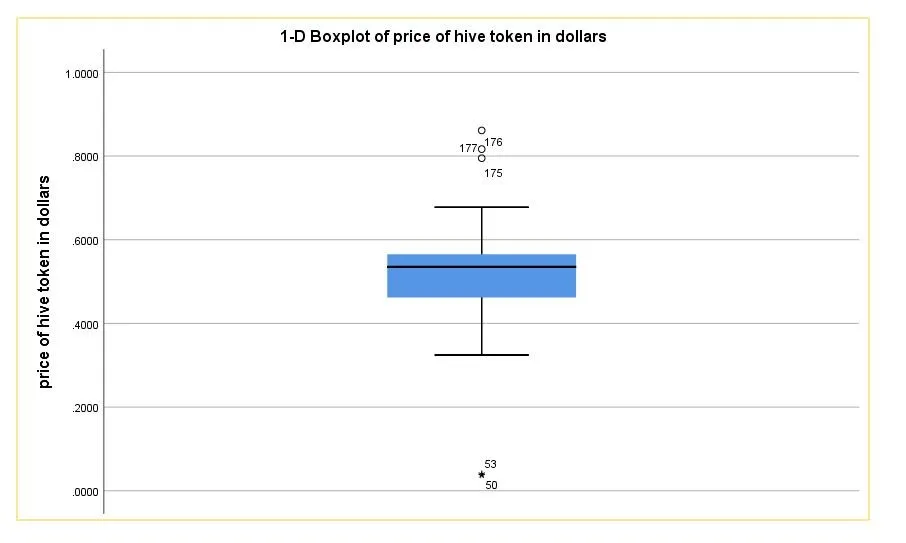
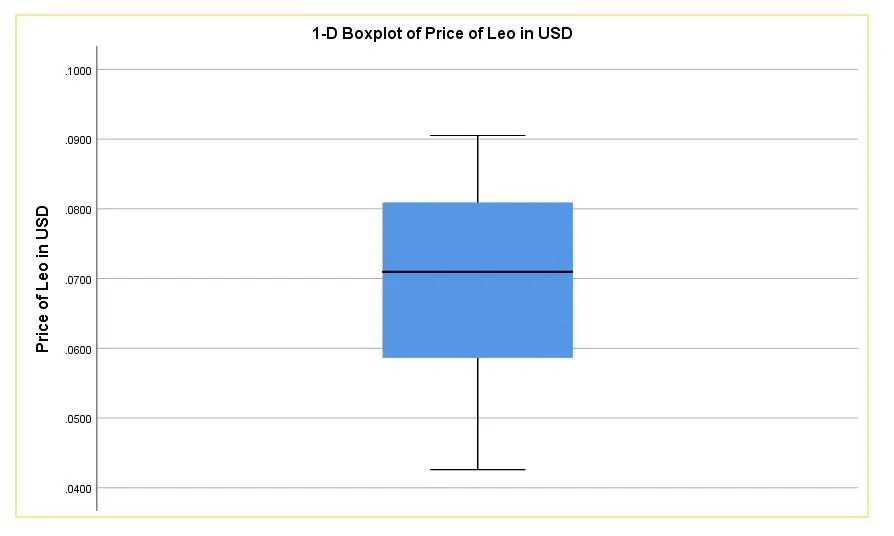
Box plot represents the range in duration of the price of a crypto asset. It shows its span across the price representing both bullish and bearish market.
Boxplot for HIVE
Box plot for LEO
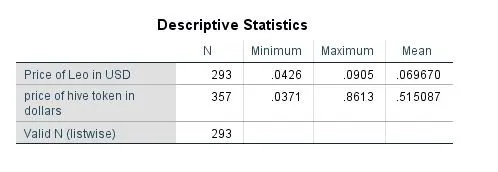
Maximum, minimum and mean price of LEO and HIVE
Thanks for reading