Today I will tell you about Technical Analysis or TA.
The technical analysis method is basically trading considering the movement of price for the purpose of making short term profit.It can be either buy or sell too.Many people think that you can make a profit by just buying from the market.That's not right.No matter where the market goes, you can make a profit if you know how to sort or lengthen the market by doing technical analysis.It is very risky but trading can be taken as a profession if you know technical analysis and trade regularly.
What are the tools of technical analysis?
Technical analysis is basically done in charts.If you go to the Trading View website
you can get a free account and do chart analysis.
You will need two types of indicators to perform technical analysis:
- Primary indicator
- Secondary indicator
What is a primary indicator?
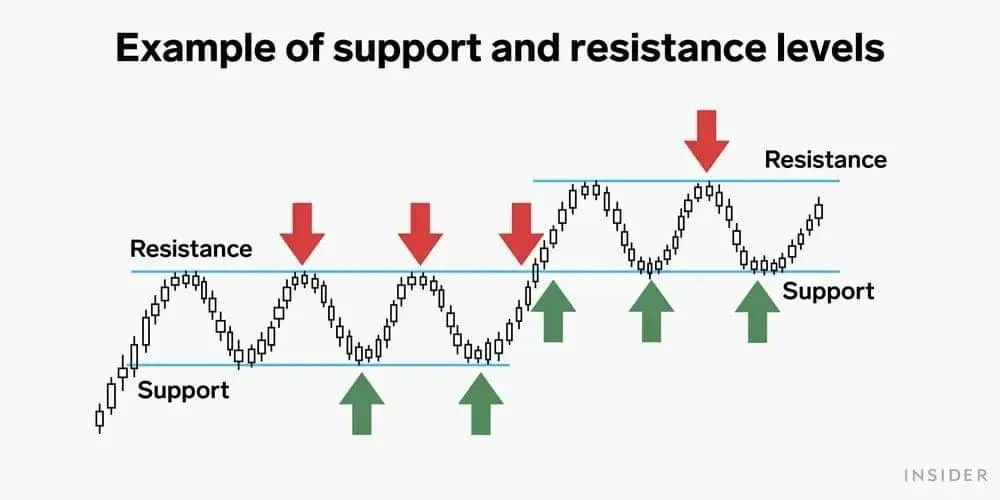
Support, resistance, trend line, counter trend line or CTL, channel, candle stick pattern, price action and round number are basically known as primary indicators.90% of your trade confirmation should come from the primary indicator because the trade confirmation of the primary indicator is very mature.There is a lot of lag in the secondary indicator so the confirmation is not correct. For example, if the price closes or opens above or below the support or resistance line, then it is much easier to predict the next move.This means that there is no need for any other confirmation.There is a need but the primary indicator carries a lot of strong trade confirmation.
What is a secondary indicator?
There are hundreds of secondary indicators including RSI, MACD, EMA or MA, OV, Volume, Pivot Point.These are based on the historical data of the market.There are some secondary indicators that work well with the primary indicators as a lot of supporting agents are MACD, EMA, RSI and pivot points.