It has been a wild bull ride this Xmas long weekend for bitcoin, with new ATHs almost daily. Peaking at $28400 on 27 December, price has had a little dip since then, but continues to find support on the 13 EMA on the 4 hour chart. In fact price dipped below the 13 EMA but never closed below it, so that support is still in tact.
However, the RSI on the 4 hour has dipped below overbought, although could still be considered in bullish territory, above 50. Even on the 1 hour chart, RSI remains bullish, bouncing along just above the 50 mark.
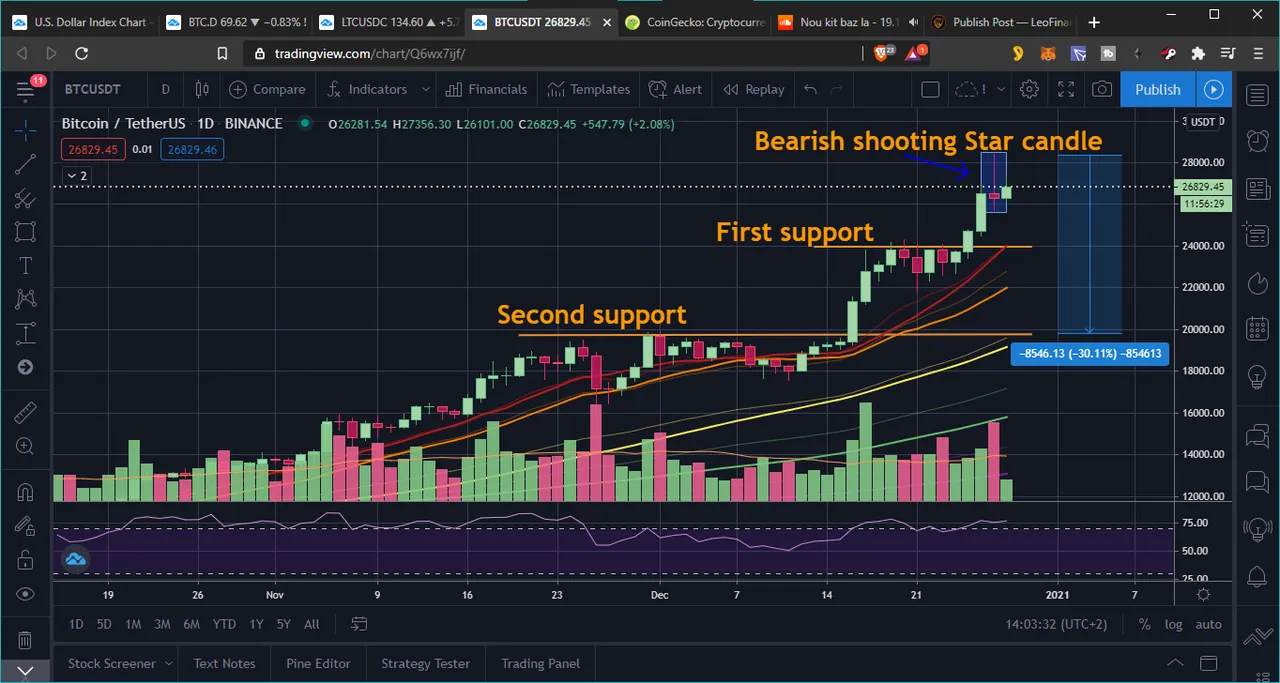
At this rate bitcoin could simply continue its parabolic uptrend, though not for ever. A retrace must come at some point – the question is when? Traders are expecting price to hit $30k and then dump. The daily RSI remains overbought. If there is a dip, the first obvious support would be previous resistance at around $24k – also the daily 13 MA.
One thing we need to remember is that these kind of parabolic uptrends are balanced by a dump soon after. And the weekly chart shows us how the last two weekly candles have been the biggest candlesticks for a long time. Naturally in a blow off top, the last candles will be the longest. So what we are seeing now on the weekly chart are clear signs of a parabolic move about to reach its culmination.
Price is so overbought on the weekly – with RSI around 90, that the MAs have been left way below. The 13 weekly EMA is approaching the massive support of $19500, and the ultimate support for a bull market – the 21 weekly MA – has now risen to $15.3k for the SMA and $16.9 for the EMA. You can decide which one is more valid. I can’t say either way.
Amazingly the weekly RSI at 90.5, is higher than it was at the last ATH of $20k in December 2017, when it only reached 88.5 on the Binance USDT chart. This means we are more overbought now than back then on the weekly RSI. That tells you something. It suggests that a retrace is imminent, although that has been the case for over two weeks now.
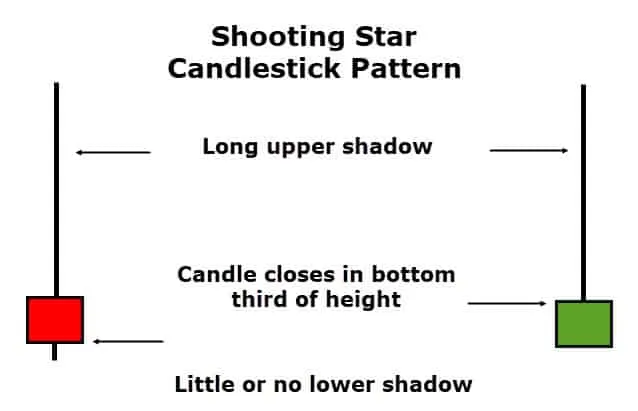
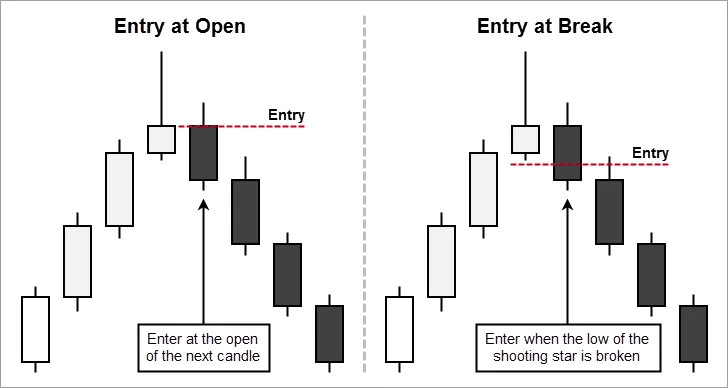
Yesterday’s daily candle looks like a “shooting star” which – in an uptrend – is a bearish reversal indicator. However, so far price is holding well, so let’s wait and see if today’s candle also closes bearish. The shooting star can be traded in different ways, as seen in the graphic. We can wait for the next daily candle to break below the shooting star body, or its wick, to enter a short position.
The bitcoin dominance chart shows a clear downtrend, breaking and closing below the 13 and 21 MA s on the 4 hour chart, something we have not seen since 9 December, almost 3 weeks ago. ETH is catching up to BTC as can be seen in the rising ETH/BTC value, so this could be a chance for alts to pump now as Bitcoin consolidates again.
There are numerous other fundamental indicators that need to be considered. One obvious issue is the massive gap in the CME bitcoin futures price today. Because they closed on Thursday for Xmas and the weekend, bitcoin simply carried on trading upward and left the CME price $3000 dollars below. The gap now on Monday morning is so huge that the CME Group have been forced to suspend trading their bitcoin futures.
They are the biggest bitcoin futures trading platform globally, though I’m not sure if this will affect price action or not. Apparently these gaps are usually filled, implying that price has to retrace $3000 to fill it at some point, which may take us back to the support at the $24k region.
A 30% retrace would not be unusual now in bitcoin’s bull cycle, which would take us back to support at $19.5k. However, institutional buying is massive and unprecedented, so the dip may not even fall that low. At least not in a hurry. But Q1 2021 may be bearish overall, allowing the retrace to bring a more sustainable and organic long term growth pattern.