The unix philosophy is to have each tool do its job well. I saw an opportunity to combine three simple tools (zsh for scripting, gnuplot for charting, and jq for json querying) to make a live crypto charting program that has the advantage of being very resource unintensive (both ram and cpu).
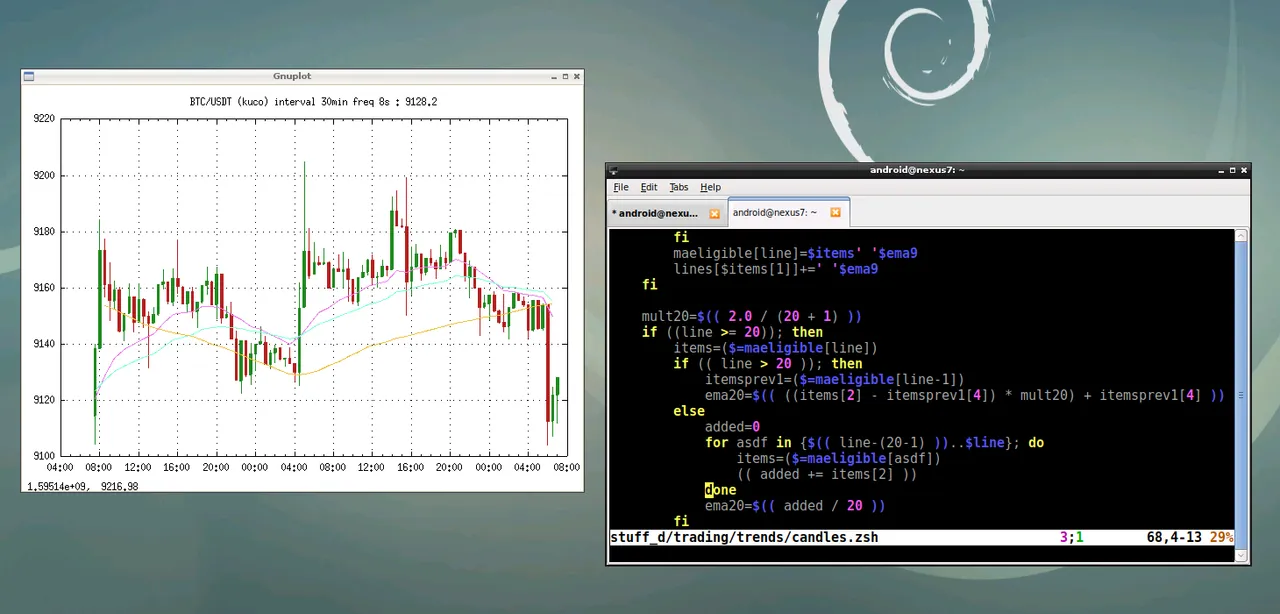
As can be seen in the screenshot, this script will launch a live chart of whatever crypto pair is wanted, with a configurable polling frequency. Developed for and on Linux, it will work on Windows and Mac OSX with the appropriate compatibility layer. Dependencies are Gnuplot with x11 output, curl, jq, and zsh.
Here is the script:
#!/bin/zsh

while [[ $1 == -* ]]; do
        arg=${1#*=}
        case $1 in
                --symbol=*) symb=$arg ;; # ex. BTC-USDT
                --interval=*) kucoint=$arg ;; # ex. 1day
                --help|\
                -h) sed -n '/case .1/,/esac/p' "$0" | grep -- '^\s\+\-.*)'; exit 0 ;;
                *) echo wrong option; exit 1 ;;
        esac
        shift
done

[[ $symb ]] || symb=BTC-USDT
[[ $kucoint ]] || kucoint=30min
per=1800
multfactor=2
[[ $kucoint == 4hour ]] && { per=14400; multfactor=6; }
[[ $kucoint == 1day ]] && { per=86400; multfactor=30; }
freq=8
time=`date +%s`
timecopy=$time
(( time -= (60 * 60 * 48 * multfactor) ))
tznum=`date +%z`
tz=${tznum:0:1}$(( (${tznum:1:2} * 3600) + (${tznum:3:2} * 60) ))

url="https://api.kucoin.com/api/v1/market/candles?symbol${z/'
        '/}=$symb&type=$kucoint&startAt=$time&endAt=$timecopy"
json=`curl -s $url`
#echo $json > ~/candleszshtest.txt
#json=$(< ~/candleszshtest.txt)

function calcmvs
{
        local line=$1
        local items

        mult9=$(( 2.0 / (9 + 1) ))
        if ((line >= 9)); then
                items=($=maeligible[line])
                if (( line > 9 )); then
                        itemsprev1=($=maeligible[line-1])
                        ema9=$(( ((items[2] - itemsprev1[3]) * mult9) + itemsprev1[3] ))
                else
                        added=0
                        for asdf in {$(( line-(9-1) ))..$line}; do
                                items=($=maeligible[asdf])
                                (( added += items[2] ))
                        done
                        ema9=$(( added / 9 ))
                fi
                maeligible[line]=$items' '$ema9
                lines[$items[1]]+=' '$ema9
        fi

        mult20=$(( 2.0 / (20 + 1) ))
        if ((line >= 20)); then
                items=($=maeligible[line])
                if (( line > 20 )); then
                        itemsprev1=($=maeligible[line-1])
                        ema20=$(( ((items[2] - itemsprev1[4]) * mult20) + itemsprev1[4] ))
                else
                        added=0
                        for asdf in {$(( line-(20-1) ))..$line}; do
                                items=($=maeligible[asdf])
                                (( added += items[2] ))
                        done
                        ema20=$(( added / 20 ))
                fi
                maeligible[line]=$items' '$ema20
                lines[$items[1]]+=' '$ema20
        fi

        if ((line >= 50)); then
                items=($=maeligible[line])
                if (( line > 50 )); then
                        itemsprev50=($=maeligible[line-50])
                        itemsprev1=($=maeligible[line-1])
                        sma50=$(( ( ( itemsprev1[5] * 50 ) -
                                itemsprev50[2] + items[2] ) / 50 ))
                else
                        added=0
                        for asdf in {$(( line-(50-1) ))..$line}; do
                                items=($=maeligible[asdf])
                                (( added += items[2] ))
                        done
                        sma50=$(( added / 50 ))
                fi
                maeligible[line]=$items' '$sma50
                lines[$items[1]]+=' '$sma50
        fi
}

function addeligible
{
        asdf=$1
        if (( per == 1800 )); then
                # prefer 1hour MAs here
                (( ${${=lines[asdf]}[1]} % 3600 == 1800 )) || return
        fi
        maeligible+=($asdf' '${${=lines[asdf]}[5]})
}

# gnuplot expects time, open, low, high, close
raw=`echo $json | jq -r '.data | .[] | [.[0,1,4,3,2]] | join(" ")' | tac`
lines=(${(@f)raw})
for asdf in {1..$#lines}; do addeligible $asdf; done
#date +%s.%N #benchmark
for asdf in {1..$#maeligible}; do calcmvs $asdf; done
#date +%s.%N #benchmark
count=1
total=$#lines
(( total % 2 == 0 )) || { echo expected even number lines; exit 1; }
(( total = total / 2 ))
(( count += total ))
items=($=lines[count-1+total])
watch=($items[1] x $items[5])
cr_el=`tput cr; tput el`

xrdb -merge <<< "gnuplot*exportselection: off"
{
        cat <<- eof
                set terminal x11 noraise
                set grid
                set xdata time
                set timefmt "%s"
                set format x "%H:%M"
                set xrange [*:*]
                set yrange [*:*]
                set offsets 1,1,1,1
                set palette defined (-1 "#b22222", 1 "#228b22")
                unset colorbox
                set style fill solid noborder
        eof
        while true; do
                watch[1]=${watch[1]%.*}
                (( watch[3] < items[3] )) && items[3]=$watch[3]
                (( watch[3] > items[4] )) && items[4]=$watch[3]
                items[5]=$watch[3]
                items[6]=; items[7]=; items[8]=;
                curmod=$(( watch[1] % per ))
                if (( $#lastmod > 0 && curmod <= lastmod )); then
                        (( count++ ))
                        items=($((items[1]+per)) $watch[3] $watch[3] $watch[3] $watch[3])
                        lines[count-1+total]=$items
                        addeligible $((count-1+total))
                fi
                lastmod=$curmod
                lines[count-1+total]=$items
                [[ ${${=maeligible[$#maeligible]}[1]} == $#lines ]] && {
                        maeligible[$#maeligible]=${${=maeligible[$#maeligible]}[1]}${z/'
                                '/}' '$items[5]
                        calcmvs $#maeligible
                }
                cat <<- eof
                        set title "${symb/-/\/} (kuco) interval $kucoint " . \
                                "freq ${freq}s : $watch[3]"
                        \$dat << gnupeof
                        ${(F)lines[count,count-1+total]}
                        gnupeof
                        plot \$dat using (\$1+$tz):2:3:4:5:(\$5 < \$2 ? -1 : 1) \
                        notitle with candlesticks palette \
                        , \$dat using (\$1+$tz):6 notitle with lines lc rgb "violet" \
                        , \$dat using (\$1+$tz):7 notitle with lines lc rgb "aquamarine" \
                        , \$dat using (\$1+$tz):8 notitle with lines lc rgb "#e9bd3d"
                eof
                echo -n 'Options: (q)uit, (f)req ' >&2
                opt=; read -s -t $freq -k 1 opt
                print -nr- $cr_el >&2
                case $opt in
                        f)
                                echo -n 'Enter a poll frequency in seconds: ' >&2
                                read newfreq
                                [[ $newfreq =~ ^[0-9]+$ ]] && freq=$newfreq
                                ;;
                        q)
                                break
                                ;;
                esac
                oldwatchtime=${watch[1]}
                while true; do
                        watch=(`curl -s "https://api.kucoin.com/api/v1/market/${z/'
                                '/}orderbook/level1?symbol=$symb" | jq -r \
                                '[.data.time/1000, .code, .data.price | tostring]
                                | join(" ")'`)
                        (( $#watch == 3 )) && [[ $watch[2] == 200000 ]] && break
                        sleep 8
                done
                (( watch[1] - oldwatchtime > per )) && \
                        { echo exiting due to gap >&2; break; }
        done
} | gnuplot
I am posting this on Hive before anywhere else.