Greetings dear friends of @LeoFinance before continuing, it is to be emphasized that the average true range indicator of standard configuration, can be used in any strategy and timeframe, however, the ATR indicator is fundamentally useful in day trading strategies.
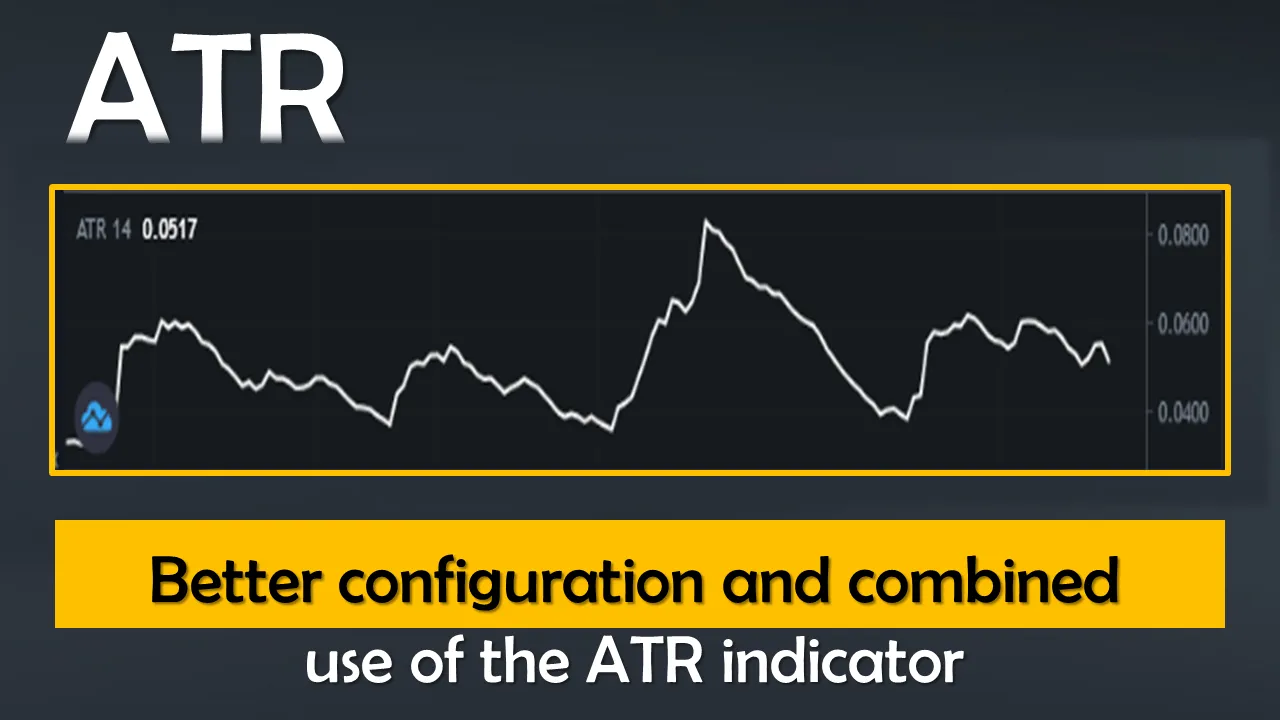
The ATR indicator is read by following the traces that form a continuous line and its cycles, which makes it possible to visualize on the chart how the volatility of a financial instrument has changed over time, since the periods with lower volatility the movement tends to constantly return to its average, while the periods with higher volatility the movement executes high peaks that correlate with an increase in the height of the candlesticks.
As we already know that ATR is a volatility indicator, it is necessary to consider that volatility measures the strength of the price action, but does not relate precise data on the direction or trend of the market, an element that makes this volatility indicator less attractive.
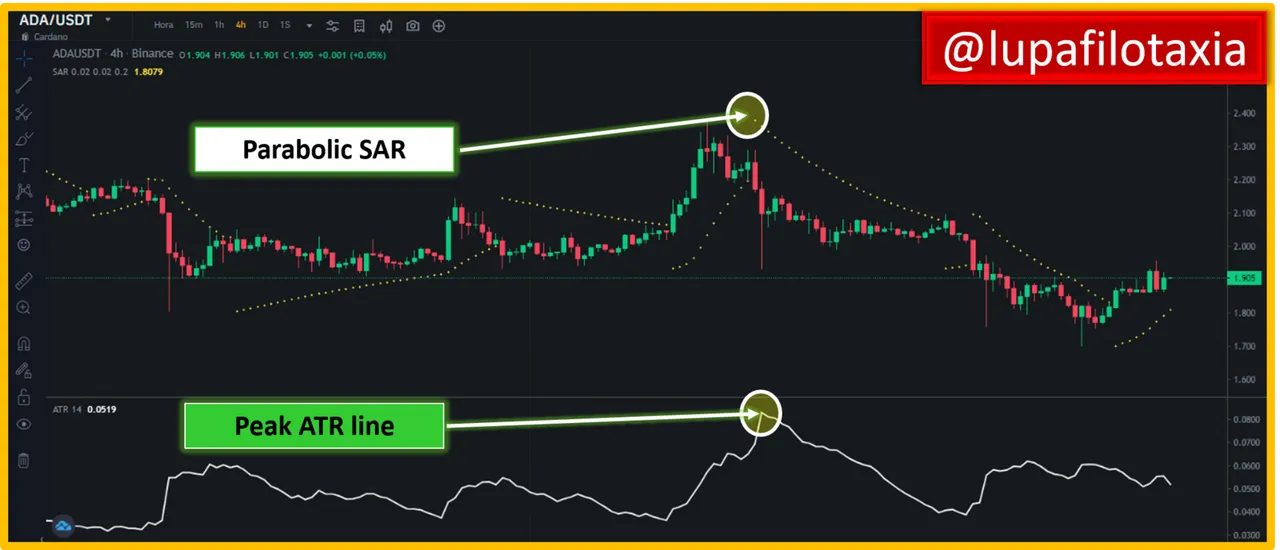
As to whether it is better to read the ATR indicator alone or with other tools, the irrefutable answer is that, since the ATR indicator is a technical tool that projects market volatility, it is best to use it in conjunction with other technical analysis tools, which in one way or another serve as a guide to gain insight into the direction of the market.
Among the recommended indicators that can be used together with the ATR are the Parabolic SAR that provides data on the orientation and strength of the trend, the Zig Zag that projects the classic movements and patterns of Elliott waves, and can also include a momentum indicator such as the "Commodity Channel Index" (CCI) indicator that would allow to know with greater probability the strength behind a price movement.
However, beyond the indicators that can be used in combination with the ATR, the most important thing to understand is that lower than standard settings offer less statistical data, which in itself makes the ATR indicator project greater sensitivity to the most recent price action movements, and therefore offer faster readings.
In the case of higher than standard configurations they project an opposite effect, because they provide a much smoother range that tends to remain relatively unchanged over long periods of time.
Well dear friends of @LeoFinance so far we have come in this post, in the next post we will talk in detail about how to know the price volatility and how you can determine the dominant strength of the price using the ATR indicator.

SOURCES CONSULTED
Cory Mitchell How Average True Range (ATR) Can Improve Your Trading. Link
OBSERVATION:
The cover image was designed by the author: @lupafilotaxia, incorporating image: TradingView

