WOM Protocol (Bithumb: WOMKRW) has broken out of the triangle pattern in the four-hour chart.
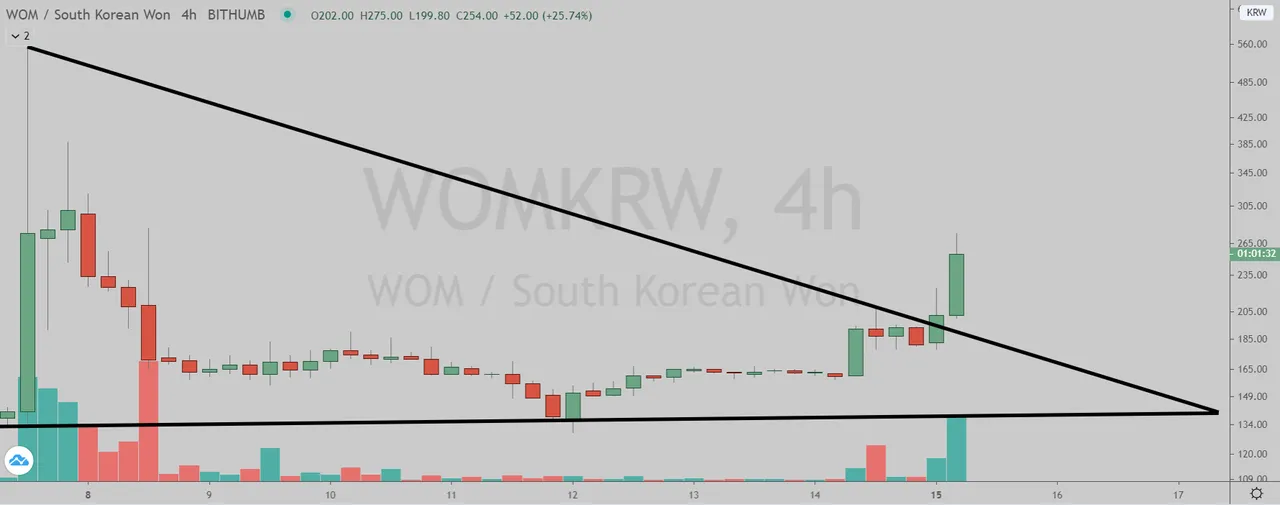
(Chart courtesy of Tradingview.com (log scale))
Elliott Wave Analysis
In Elliott Wave terms, WOM began a red wave one advance on May 11. The red wave one finished on May 16, and the red wave two correction ended on May 21. The red wave three advance finished on June 7, and the red wave four correction ended on June 12. If this wave count is correct, WOM should be heading next towards the June 7 peak in the red wave five.
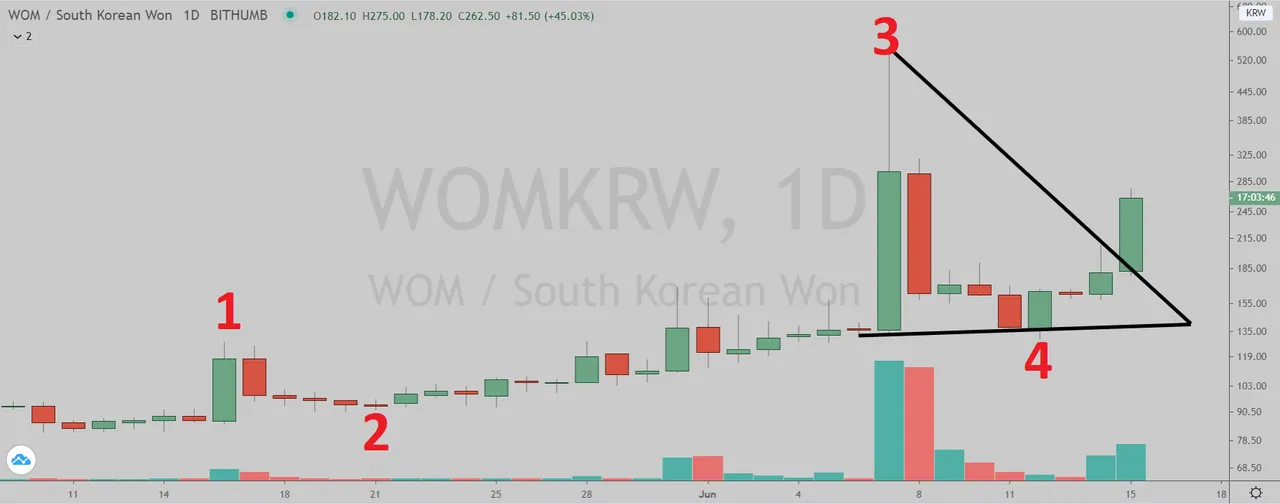
(Chart courtesy of Tradingview.com (log scale))
Zooming out in the daily chart, I believe WOM is currently in the red wave three (blue sub-wave v). The red wave three began on May 11.
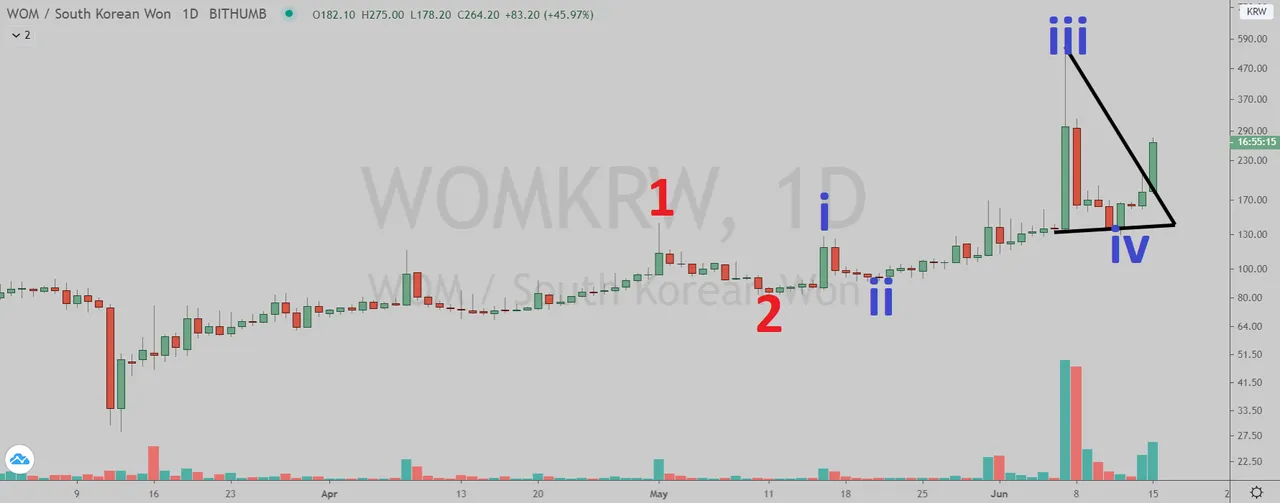
(Chart courtesy of Tradingview.com (log scale))
Funnymentals
WOM Protocol enables brands to access "genuine" word-of-mouth recommendations. You can watch their intro video below.
(Sources: https://womprotocol.io/)How Will WOM Protocol Trade?
WOM Protocol (Bithumb: WOMKRW) daily chart by Tradingview.
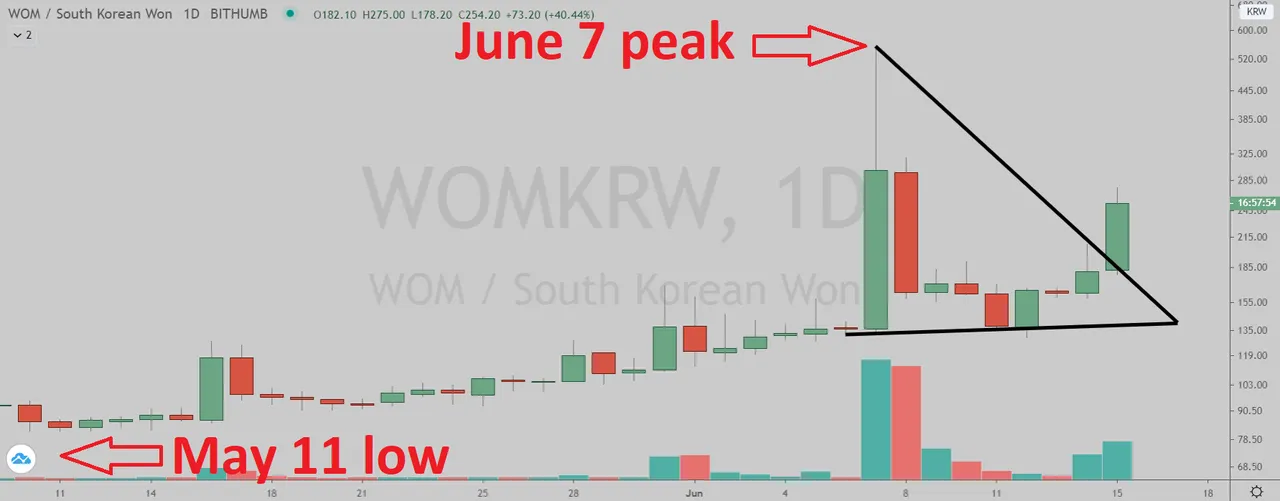
(Chart courtesy of Tradingview.com (log scale))
Prizes
I will be giving upvotes to the correct answers with minimum reputation of 25.
Rules
This poll will expire in one week. Only one vote per person.
Which one will happen first?
Please select one of the three choices and comment below.
WOM will takeout the June 7 peak
WOM will drop below the May 11 low
WOM will stay in a trading range between the May 11 low and the June 7 peak until July 20