BitcoinHD (Huobi: BHDBTC) has broken out of the triangle pattern in the daily chart.
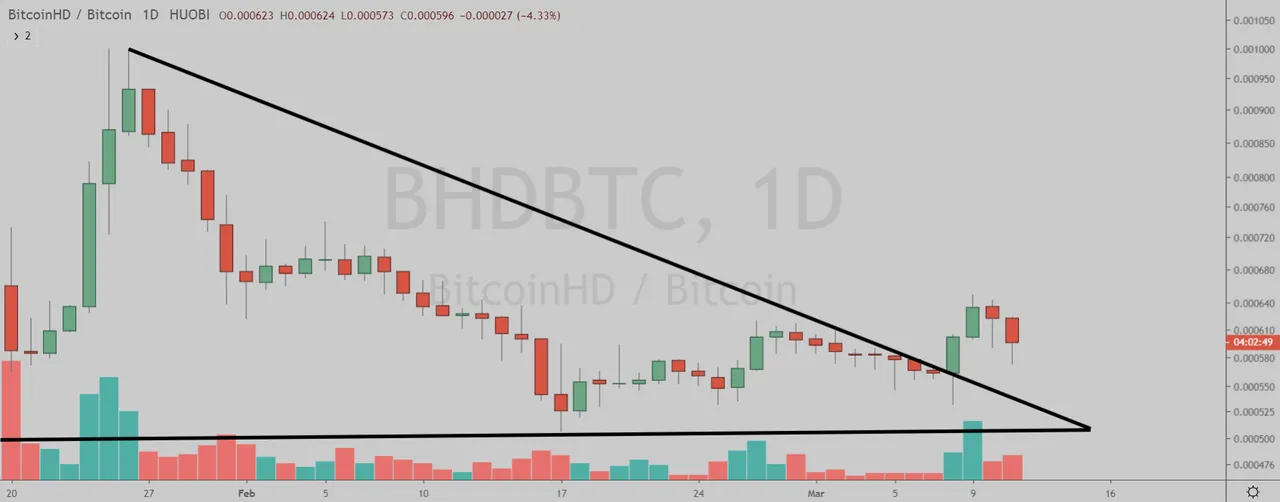
(Chart courtesy of Tradingview.com (log scale))
Elliott Wave Analysis
In Elliott Wave terms, BHD began a wave one advance on January 15. The red wave one (blue sub-waves i-ii-iii-iv-v) finished on January 26, and the red wave two (blue sub-waves a-b-c) correction ended on February 17. If this wave count is correct, BHD should be heading next towards the January 26 peak in the red wave three.
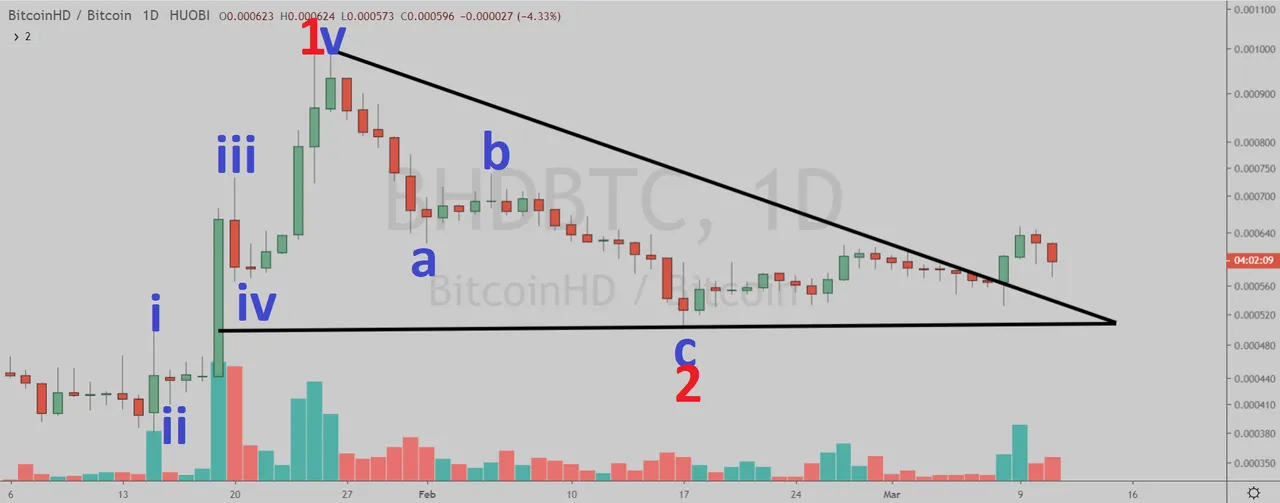
(Chart courtesy of Tradingview.com (log scale))
Funnymentals
BitcoinHD uses an upgraded version of cPOC mining (Conditioned Proof of Capacity). You can watch their intro video below.
(Sources: http://www.btchd.org/)How Will BitcoinHD Trade?
BitcoinHD (Huobi: BHDBTC) daily chart by Tradingview.
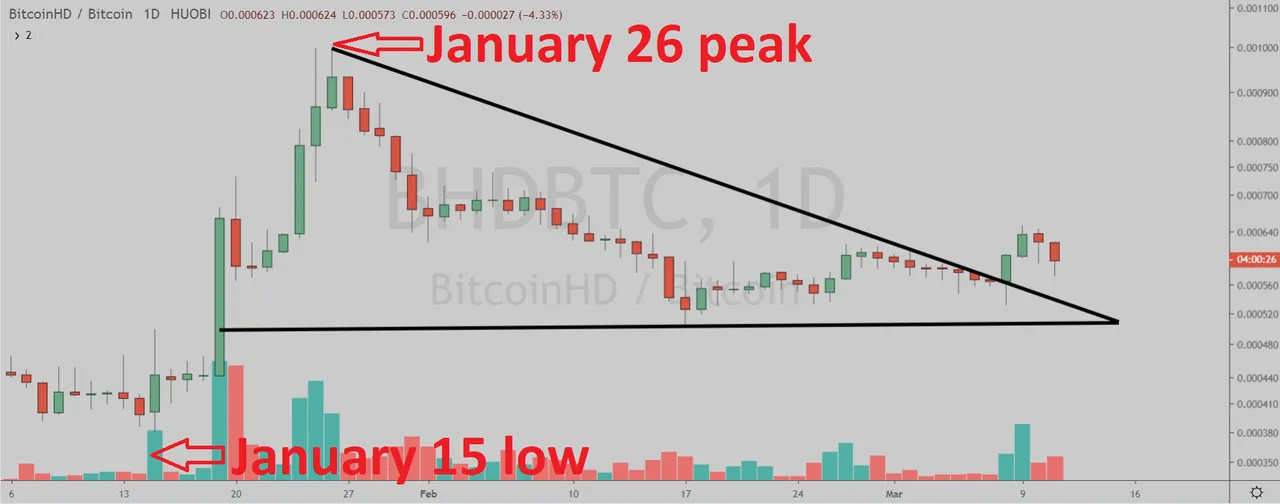
(Chart courtesy of Tradingview.com (log scale))
Prizes
I will be giving upvotes to the correct answers with minimum reputation of 25.
Rules
This poll will expire in one week. Only one vote per person.
Which one will happen first?
Please select one of the three choices and comment below.
BHD will takeout the January 26 peak
BHD will drop below the January 15 low
BHD will stay in a trading range between the January 15 low and the January 26 peak until April 14
Posted via Steemleo