Edgeless (Bittrex: EDGBTC) has broken out of the triangle pattern in the daily chart.
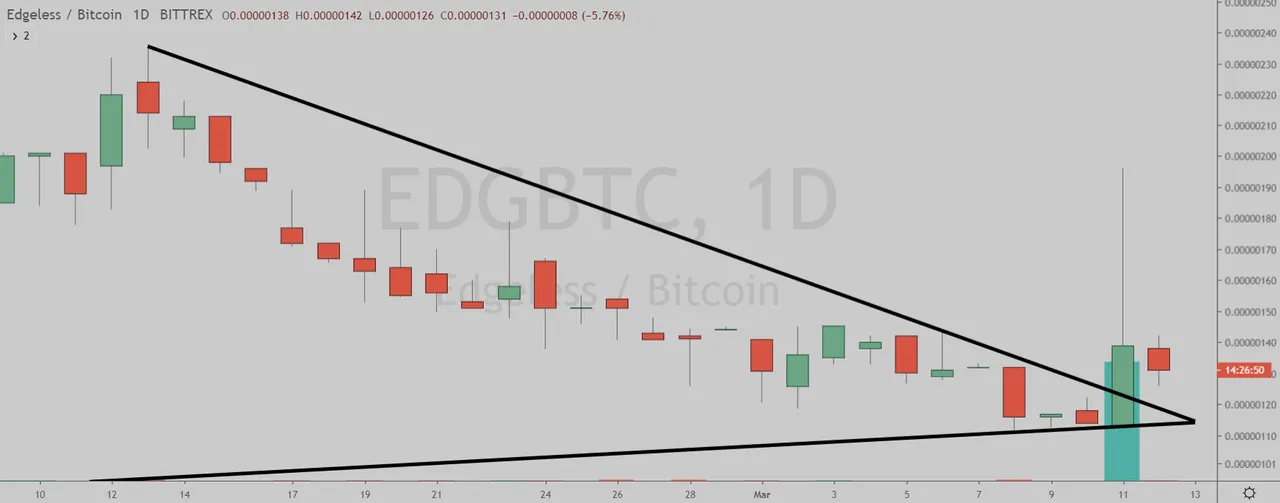
(Chart courtesy of Tradingview.com (log scale))
Elliott Wave Analysis
In Elliott Wave terms, EDG began a wave one advance on January 18. The red wave one (blue sub-waves i-ii-iii-iv-v) finished on February 13, and the red wave two (blue sub-waves a-b-c) correction ended on March 8. If this wave count is correct, EDG should be heading next towards the February 13 peak in the red wave three.
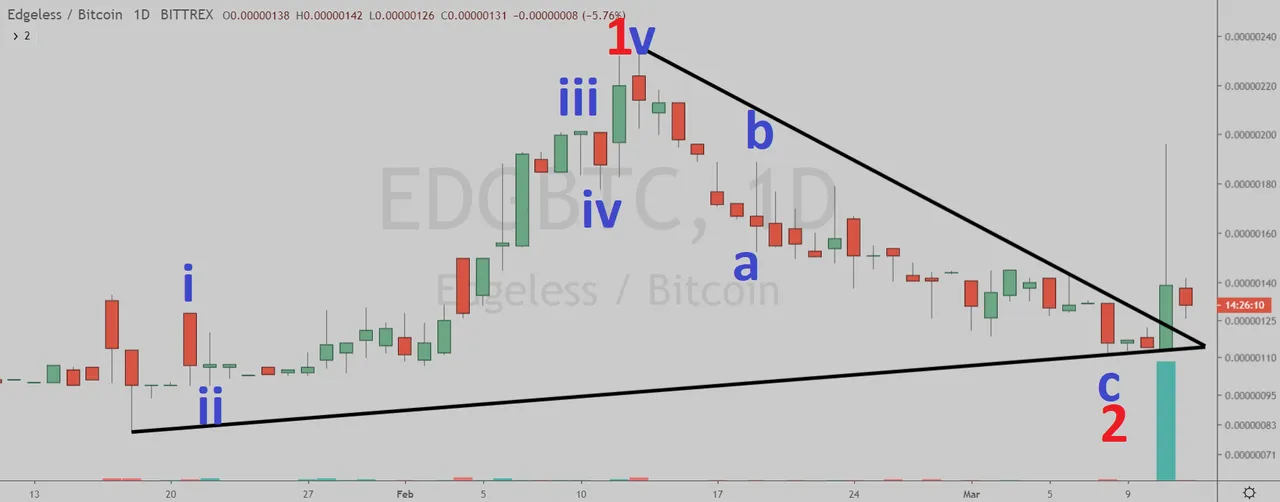
(Chart courtesy of Tradingview.com (log scale))
Funnymentals
Edgeless is a crypto casino. You can read their latest monthly report here:

(Sources: https://edgeless.io/home)
How Will Edgeless Trade?
Edgeless (Bittrex: EDGBTC) daily chart by Tradingview.
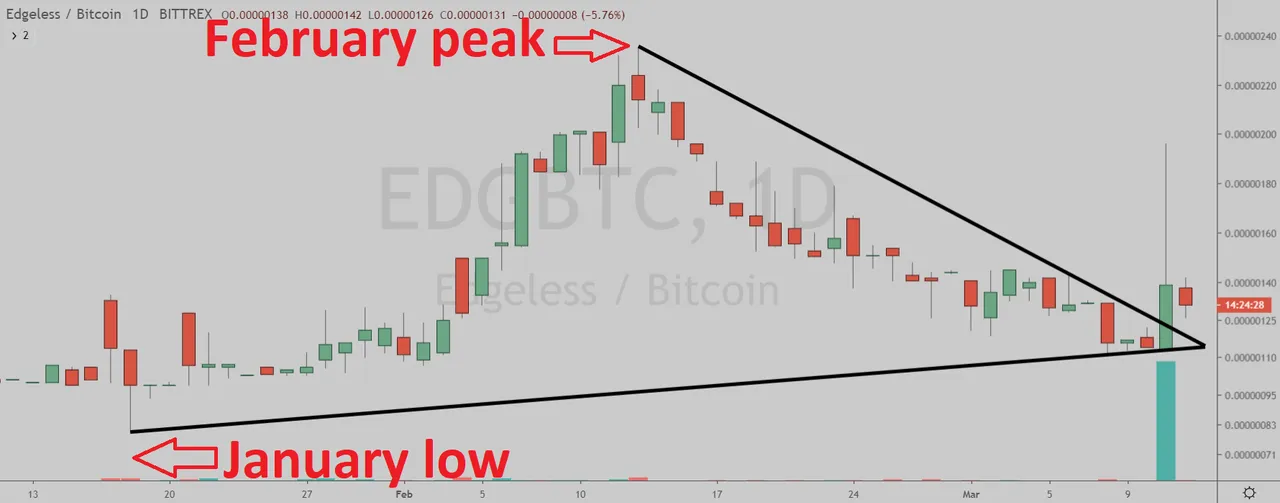
(Chart courtesy of Tradingview.com (log scale))
Prizes
I will be giving upvotes to the correct answers with minimum reputation of 25.
Rules
This poll will expire in one week. Only one vote per person.
Which one will happen first?
Please select one of the three choices and comment below.
EDG will takeout the February peak
EDG will drop below the January low
EDG will stay in a trading range between the January low and the February peak until April 15
Posted via Steemleo