TRON (Binance: TRXUSD) has broken out of the triangle pattern in the daily chart.
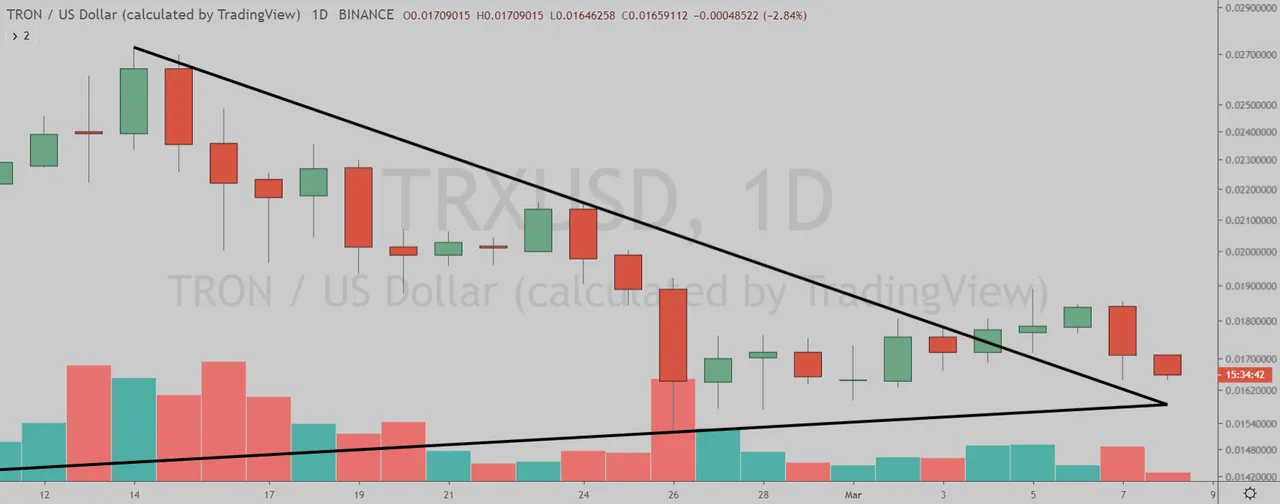
(Chart courtesy of Tradingview.com (log scale))
Elliott Wave Analysis
In Elliott Wave terms, TRX began a wave one advance on December 18, 2019. The red wave one (blue sub-waves i-ii-iii-iv-v) finished on February 14 this year, and the red wave two (blue sub-waves a-b-c) correction ended on February 26. If this wave count is correct, TRX should be heading next towards the February 14 peak in the red wave three.
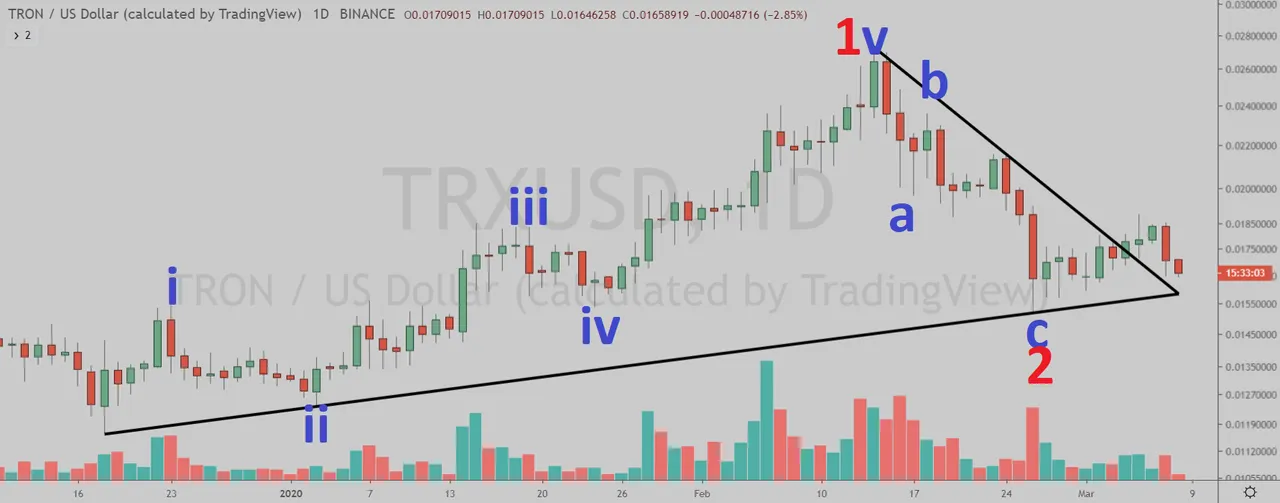
(Chart courtesy of Tradingview.com (log scale))
Looking at the weekly chart, I believe TRX is currently in the wave three (blue sub-wave iii). The blue sub-wave iii began in September 2019.
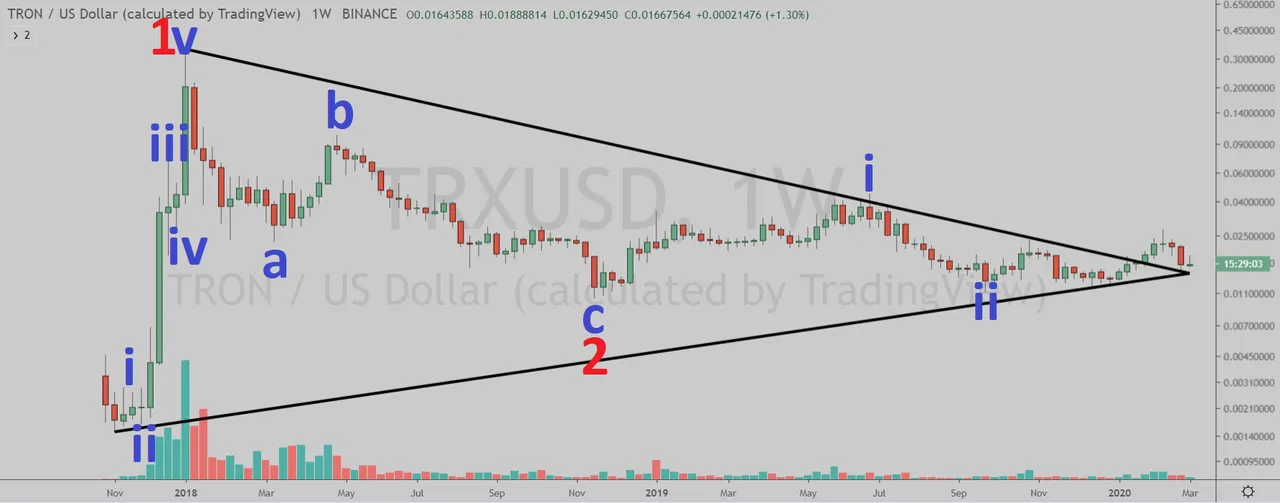
(Chart courtesy of Tradingview.com (log scale))
Funnymentals
TRON strives to build the future of a truly decentralized internet. Nugget's News interviewed Justin Sun one week ago.
(Sources: https://tron.network/)How Will TRON Trade?
TRON (Binance: TRXUSD) daily chart by Tradingview.
(Chart courtesy of Tradingview.com (log scale))
Prizes
I will be giving upvotes to the correct answers with minimum reputation of 25.
Rules
This poll will expire in one week. Only one vote per person.
Which one will happen first?
Please select one of the three choices and comment below.
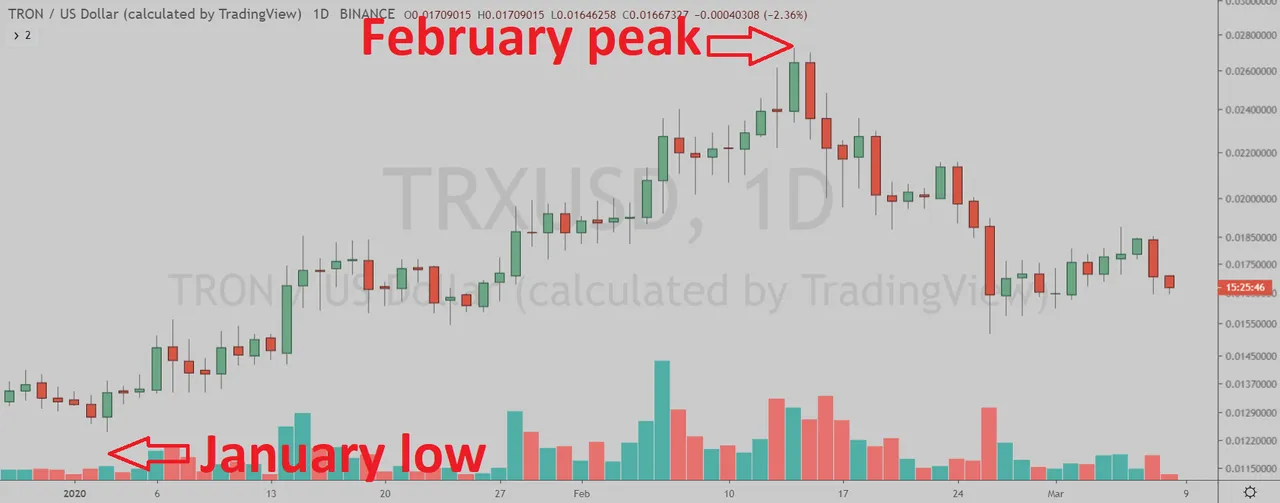
TRX will takeout the February peak
TRX will drop below the January low
TRX will stay in a trading range between the January low and the February peak until April 11
Posted via Steemleo