QuarkChain (Binance: QKCBTC) has broken out of the triangle pattern in the daily chart.
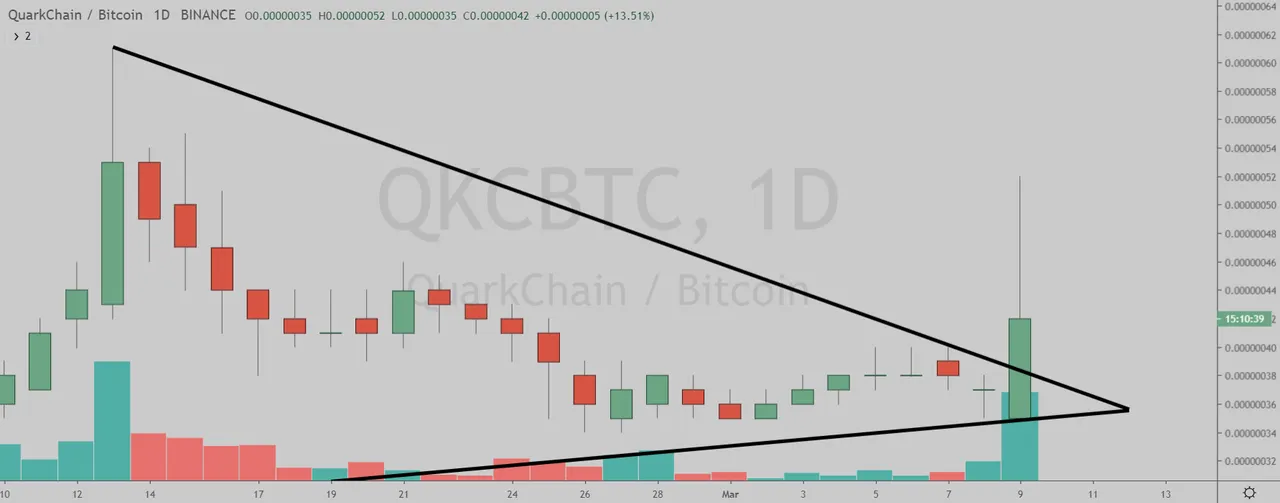
(Chart courtesy of Tradingview.com (log scale))
Elliott Wave Analysis
In Elliott Wave terms, QKC began a wave one advance on January 29. The red wave one (blue sub-waves i-ii-iii-iv-v) finished on February 13, and the red wave two (blue sub-waves a-b-c) correction ended on February 26. If this wave count is correct, QKC should be heading next towards the February 13 peak in the red wave three.
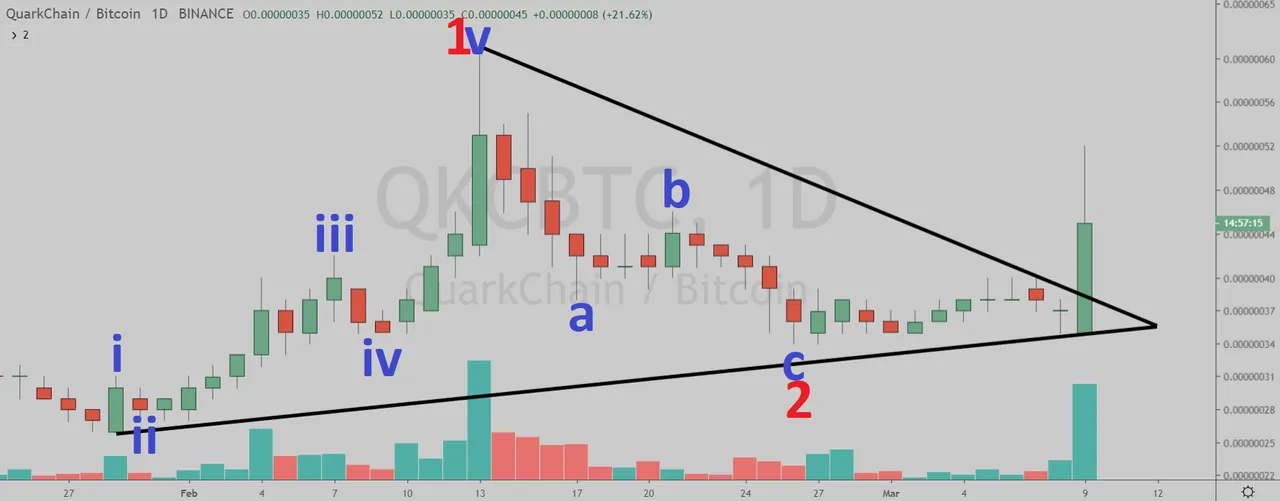
(Chart courtesy of Tradingview.com (log scale))
Funnymentals
QuarkChain aims to provide a secure, decentralized, and scalable blockchain solution to deliver 1,000,000+ on-chain TPS (transactions per second). The latest price spike could be due to the following news:

(Sources: https://quarkchain.io/)
How Will QuarkChain Trade?
QuarkChain (Binance: QKCBTC) daily chart by Tradingview.
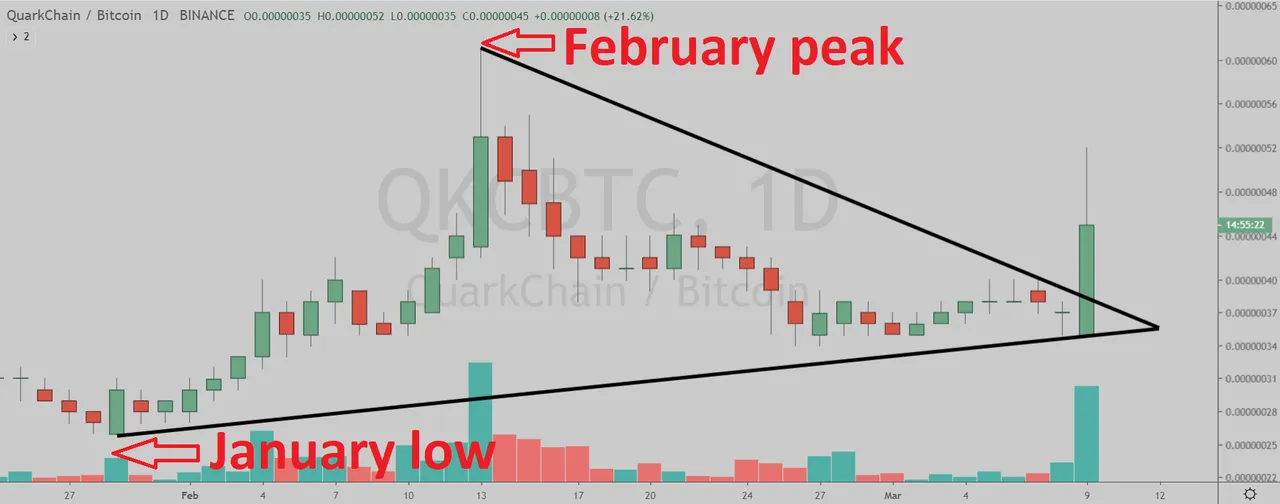
(Chart courtesy of Tradingview.com (log scale))
Prizes
I will be giving upvotes to the correct answers with minimum reputation of 25.
Rules
This poll will expire in one week. Only one vote per person.
Which one will happen first?
Please select one of the three choices and comment below.
QKC will takeout the February peak
QKC will drop below the January low
QKC will stay in a trading range between the January low and the February peak until April 12
Posted via Steemleo