CoinEx Token (CoinEx: CETUSDT) has broken out of the triangle pattern in the weekly chart.
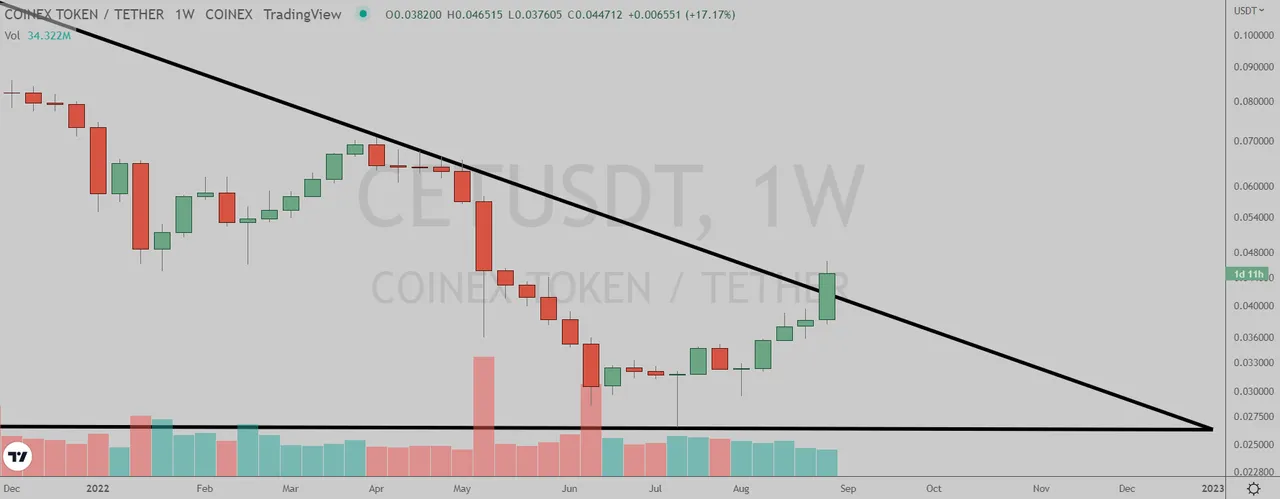
(Chart courtesy of Tradingview.com(log scale))
Elliott Wave Analysis
In Elliott Wave terms, CET began a red wave one advance in November 2020. The red wave one (blue sub-waves i-ii-iii-iv-v) peaked in May 2021 and the red wave two (blue sub-waves a-b-c) correction ended in July this year. If this wave count is correct, CET should be heading next towards the May 2021 peak in the red wave three.
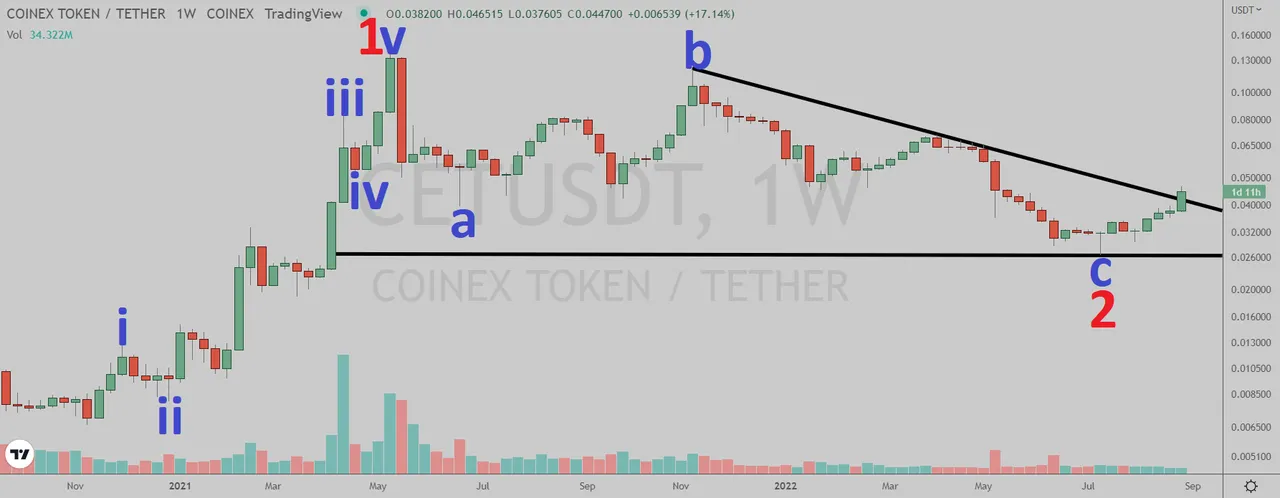
(Chart courtesy of Tradingview.com(log scale))
Funnymentals
CoinEx Token is a value-added services & privileges scheme based on CoinEx's business ecosystem. You can watch their intro video below.
(Sources: https://www.coinex.com/)
How Will CoinEx Token Trade?
CoinEx Token (CoinEx: CETUSDT) weekly chart by Tradingview.
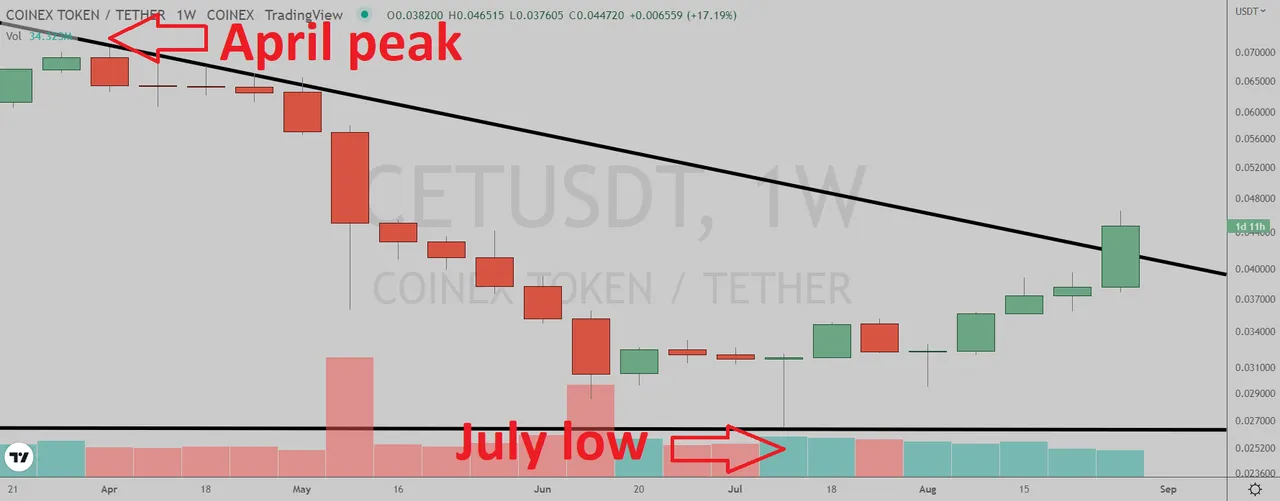
(Chart courtesy of Tradingview.com(log scale))
Prizes
I will be giving upvotes to the correct answers (posts only).
Rules
This poll will expire in one week. Only one vote per person.
Which one will happen first?
Please select one of the three choices and comment below.
CET will takeout the April peak
CET will drop below the July low
CET will stay in a trading range between the July low and the April peak until October 10