
Author: @madridbg, through Power Point 2010, using public domain images. Froilan Fernández
Greetings and welcome dear readers of this prestigious platform, especially to all those users who make life daily and the community of @Leofinance, this publication is associated with some projections that are being made on the cryptocurrency market, especially in the behavior and action that has generated Bitcoin in the last week, assuming this asset as the maximum reference for the aforementioned market.
In such a way that for the date of this publication, the value of BTC in the market is trading above $21,000 and its behavior allows us to glimpse that the selling pressure has ceased or has lost strength, obtaining as the lowest floor for this period of time, the area associated with $17,000.

However, we must be aware and specifically in the protections and speculations that are made in daily and weekly chart that the market still has strength and bearish direction supported by indicators such as ADX and MACD, so, from our analysis the projection with greater statistical possibility that is presented is the generation of an accumulation range, which we can assume that it can move around the $20,000 to $23000 and after that, a new downward break could be generated to reach the true floor for Bitcoin and the rest of the cryptocurrencies in the bearish scenario we are living.
In my opinion, I believe that the worst is not over and that we must learn to adapt to the different scenarios and processes that the market presents us, so this projection is based on the fact that statistically the month of June, has been one of the months where the worst performance in the crypto market is observed since 2018, where for the three weeks that go of the month already presents negative falls that exceed 34.2%.
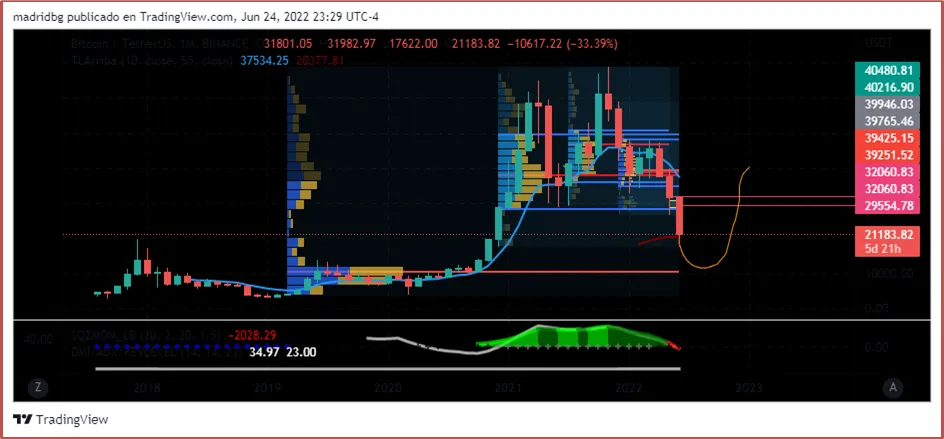
Screenshot of BTC behavior on a monthly chart Author:tradingview
Now, and by way of reinforcing the previous idea, let's analyze the chart above, in this we can observe each of the bearish scenarios what have been presented in Bitcoin, which we have been following through Fibonacci retracements.
In this sense, through this indicator, we can delimit each generated retracement, so that we can determine and project the fall area by important trading zones at the Bitcoin level and to surprise the technical projection have not yet been met, which allows us to infer that the current upward momentum that is occurring in the market should be handled with caution, since the manipulation in the market is at the surface and the only intention of these is that we can get caught by the emotion or the fomo that is being promoted and that is based on a bullish breakout, although at a technical level there are not the necessary conditions for this to happen.
OF INTEREST