Greetings and welcome dear readers of this prestigious platform, especially to all those users who make life daily in the #LeoFinance community, the present publication has as its premise to make an approach to the implications of technical analysis when generating timely and positive results in the cryptoassets market.
Therefore, we will rely on some specific patterns that occur when we approach the behavior of the price according to the Zig-Zig indicator, in which the respect of these patterns or the strategy that we have decided to adopt, are determining aspects that gives us the possibility of being or not profitable when trading.
At this point, the zigzag indicator is assumed as a financial instrument with technical implications, which allows us to monitor the price action, highlighting aspects associated with trend following, as well as the important trading points that many analysts use to determine stop loss and take profit zones according to the delimited supports and resistances.
Therefore, it is necessary to take into account that the price moves in waves and this behavior makes possible the formation of highs and lows, zones that delimit the studied indicator and that we can take advantage of to speculate in relation to the price action, so that the zigzag has the quality to ignore the small movements of the price of an asset and takes hold in those that are accompanied by a good market capitalization or capitalization volume in that period of time, in this way it becomes very effective in following the price, hence it is very attractive for expert analysts when making decisions and this is the reason for these lines of writing.
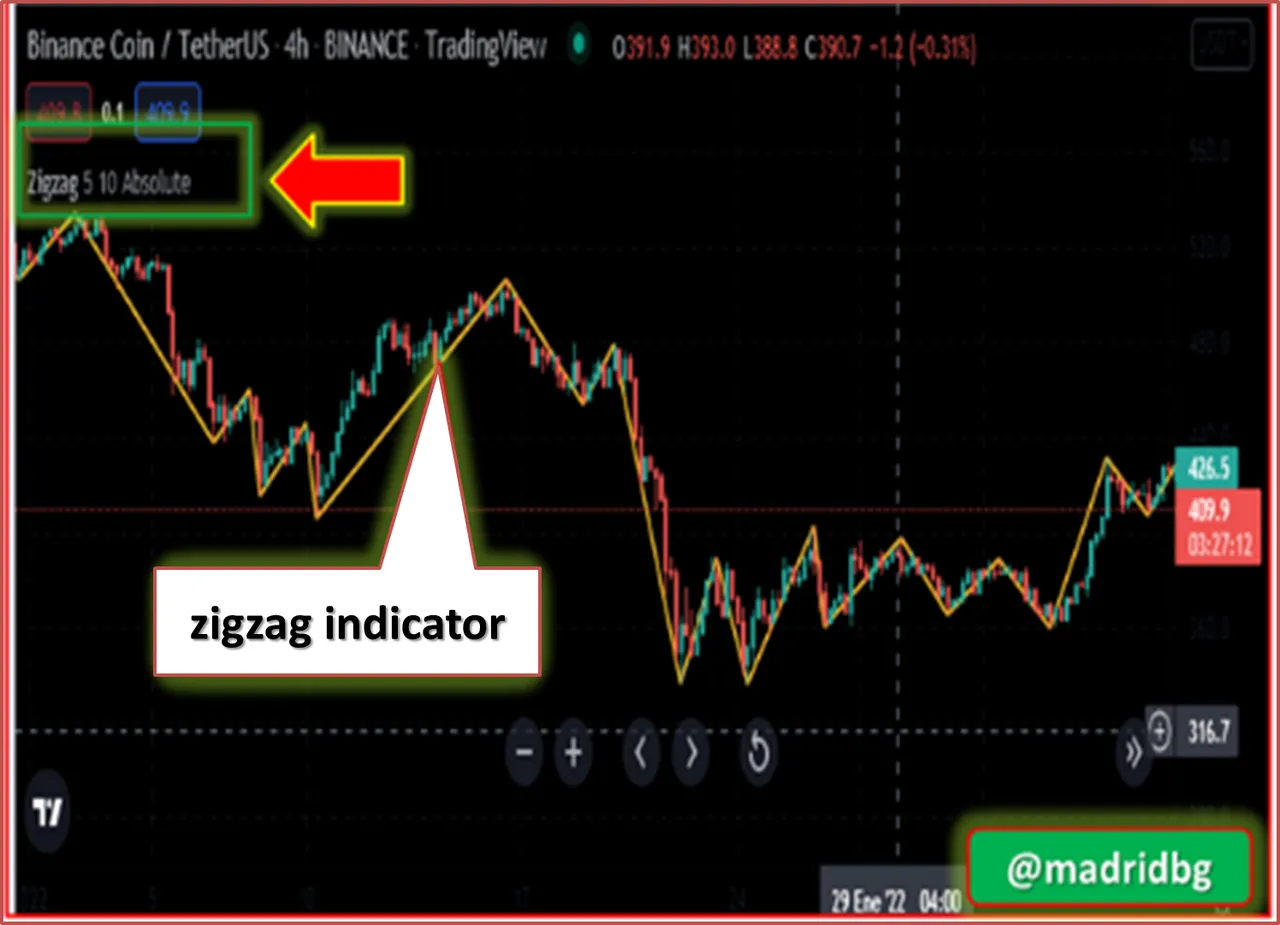
Screenshot of a 4-hour chart of the BNB-USDT pair. Author: tradingview
Based on the above, let's analyze the following behavior at the chart level, in it we can see that the indicator moves in precise descending and ascending lines, leaving aside the small movements of the price, thus generating a large percentage depth, so that under these parameters, the indicator shows us the price action and gives us valid information for this behavior, now the input zones we can run it with other financial tools that suits these, among these include the RSI, ADX or MACD to mark strength and direction in the movement of the price of an asset.
In order to understand the usefulness of this indicator, it is necessary to know that during bearish movements, the price will move within the depth interval, so the indicator line will start its movement once the distance exceeds the deviation generated, identifying the lowest price generated.
This same behavior is presented inversely and will be the qualities that will determine the upward movement of the price of the asset in question, there are also specific parameters that we will address in the second part of this material, which is oriented to the use of the depth of the movement to delimit the zones of action in the price.
OF INTEREST