What market phase are we entering into has been the introduction question of the last appointments. But here, in the last week (like the earlier one) nothing so relevant happened. So I will be quiet brief.
Let’s start from our usual weekly perspective
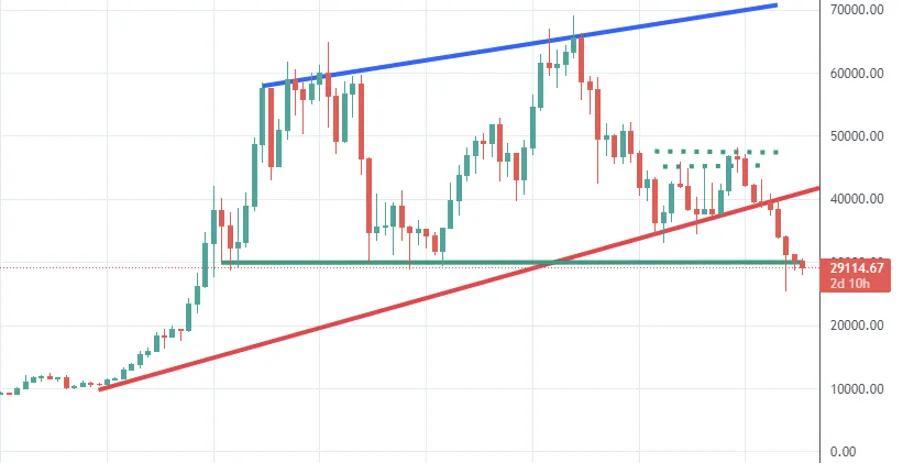
Weekly Chart
The weekly candle started just on the support line, starting another red candle. The ninth consequent red weekly candle. A record. Not really the record we were hoping for, but still a dropdown not dramatic, so far.
What do I expect from a daily perspective?
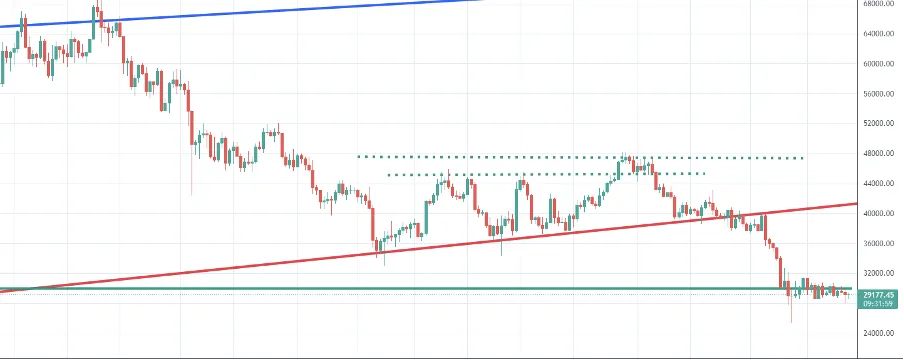
Daily Chart
Here is a daily chart, where the usual continuous red and blue lines are still clearly visible.
Price is still ranging upon the Green Line, creating more and more uncertainty. There are small drawdowns that are immediately absorbed.
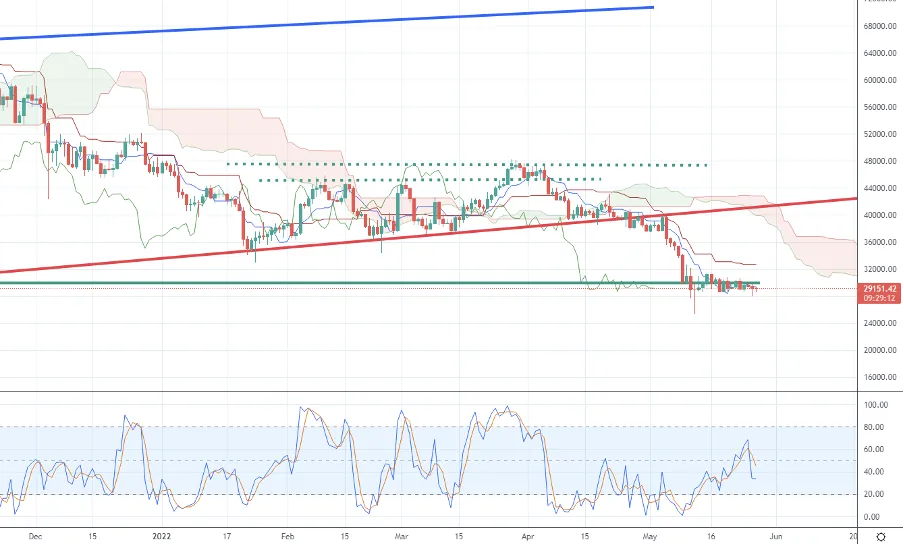
Daily Chart
Ichimoku have established on a level, red area, wide area. Statistically, that makes it more hard to cross it upwards. That is something bearish, not enough for being bearish.
What makes me more bearish is that Gold has been rising up in the last days and that usually bring Bitcoin to downwards movement. Especially rumors of the “probably rising war” have started again influencing the price.
What to observe particularly?
On a daily perspective anyway, the Stochastic is in the middle of the blue area and Ichimoku are not much expressive.
The price is still in a very uncertain area so this time, I suggest to be very very cautious. The moment can be very dangerous if you are not using a bi-directional or arbitrage system integrated into the trading system.
Let me know what you think about this new weekly appointment, and what indicators you would like to be taken into consideration more (or even explained).
Stay tuned and be sure to follow to get noticed when my contents come out.