Hello everyone!
Today I am here to talk about the Bollinger Bands. Bollinger band is a technical trading indicator. It is useful for the prediction of the trend. We can identify the trend reversals and it is particular useful in the volatile market as it helps us to observe the liquidity of the market as the price moves.
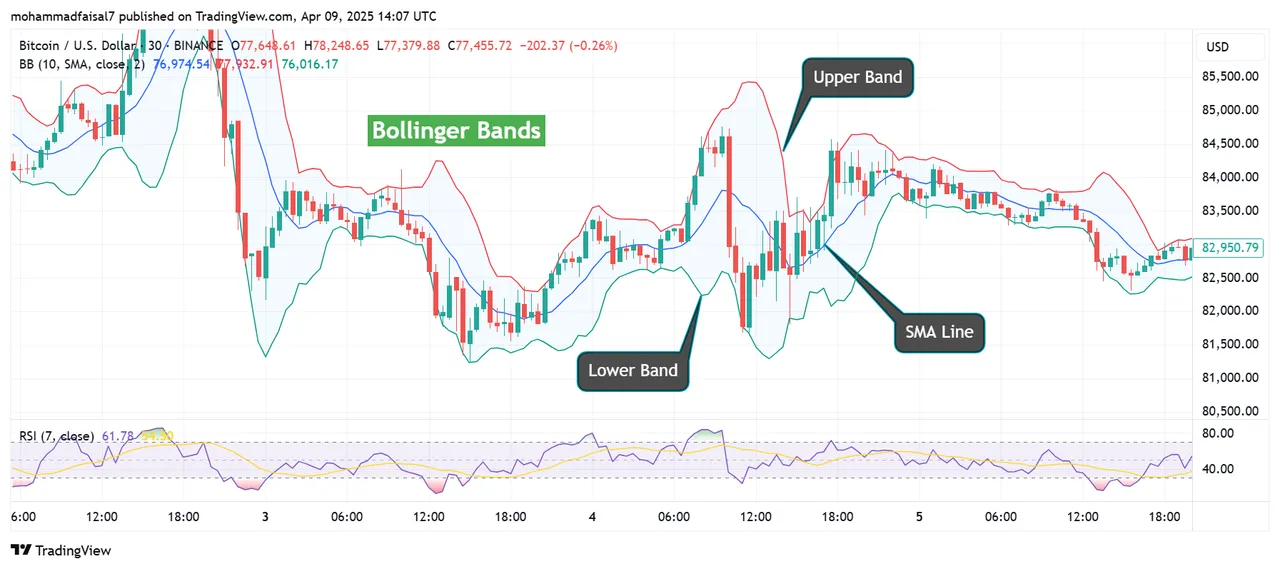
There are four main components of the Bollinger Bands indicator. These are given below:
- Upper Band
- Lower Band
- Middle Line
- Gap between Upper and Lower Bands
In the above picture I have highlighted the upper band, lower band, SMA line. In the further post I will explore the function of these components and will tell how these help in trading.
We can identify two main conditions in the market with the jhelp of the bollinger bands:
- Oversold
- Overbought
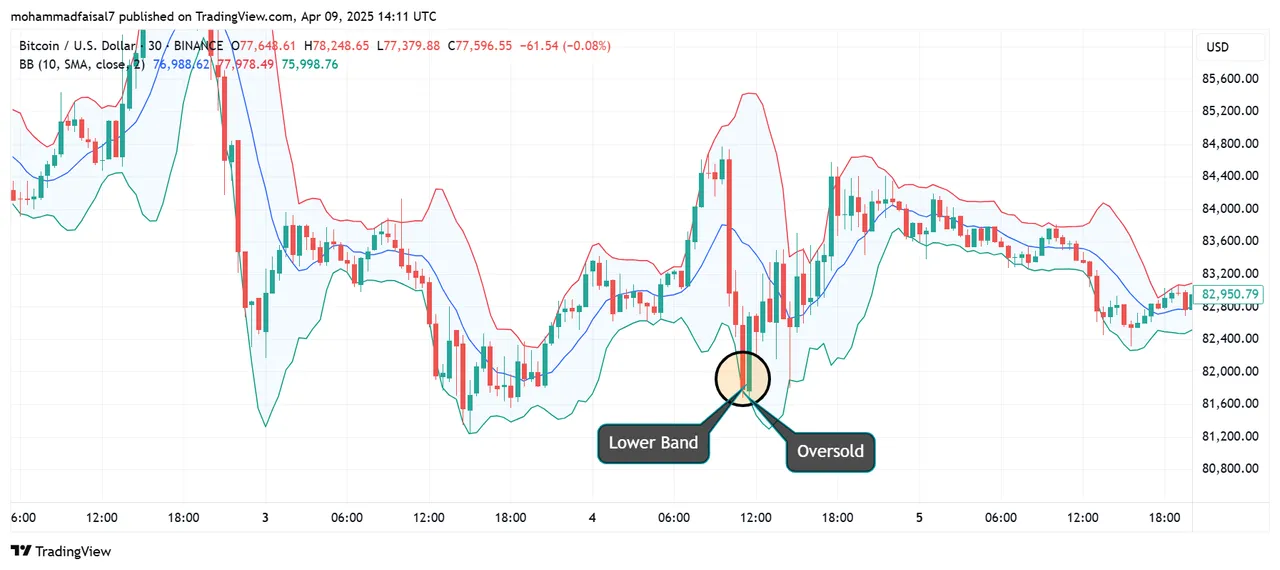
When the price in the market touches the lower band due to the huge selling pressure then this is known as oversold condition in the market. This oversold behaviour of the market leads towards the bullish trend in the market. When the oversold happens then it is the sign that the price will bounce back by reversing the current trend. And the traders can take entry when the market oversolds.
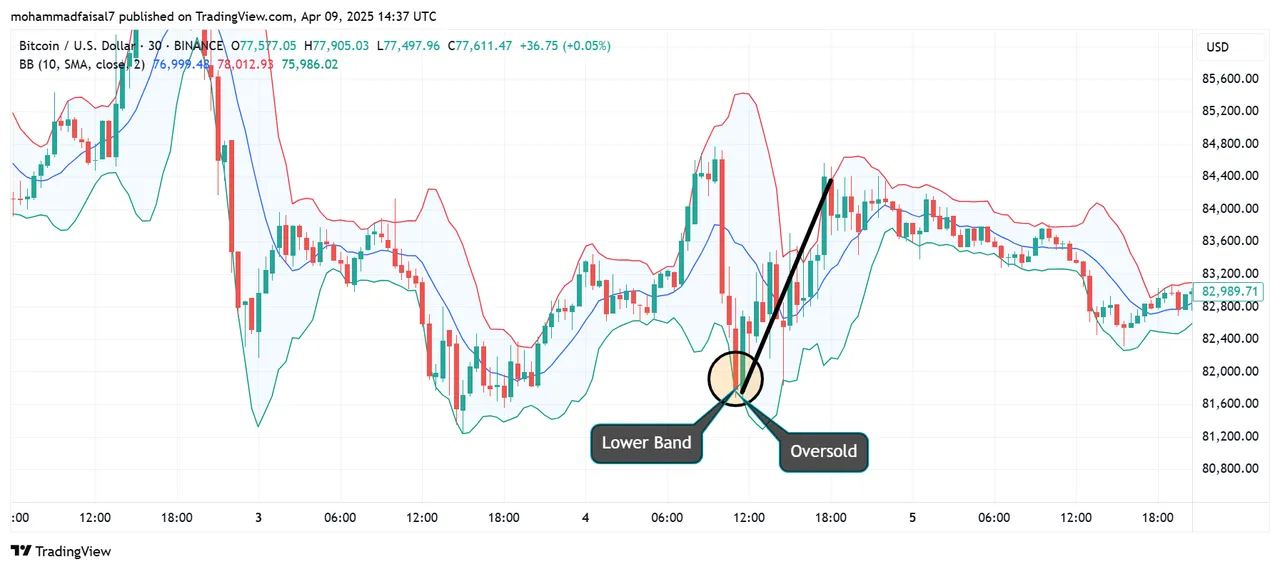
We can see when the market oversold the price of BTC took a reversal in the trend and went in the upward direction. The trend is confirmed when the price touches the lower band and then it rises upward and crosses the middle line or SMA line. It is the good opportunity for the investors to buy the assets and hold for the profit.
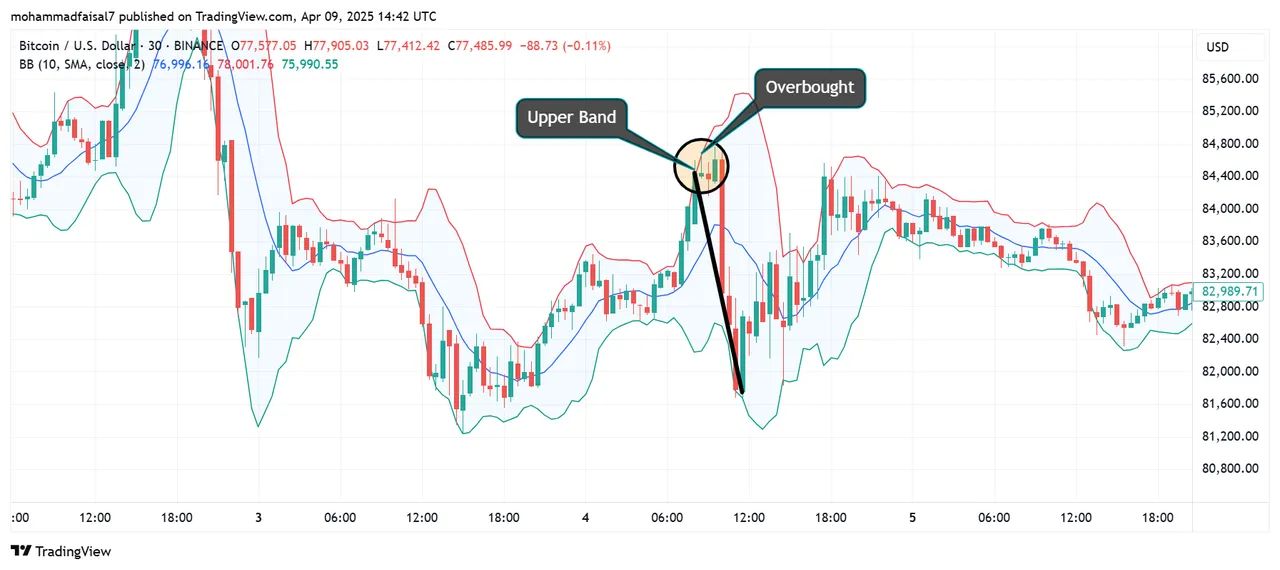
When the buyers are buying the assets continuously then in the market there occurs a moment when the price touches the upper band of the bollinger bands, it is known as the overbought. It shows the reversal in the market. As soon as the price touches the upper band or overbought condition happens the market retests itself. You can see in the chart the market did a retest after the overbought condition and the price went down. The downward trend is confirmed when the price touch the upper band and crosses below the SMA line. In order to lock the profits the trader can quit the long trades and can enter the short trades.
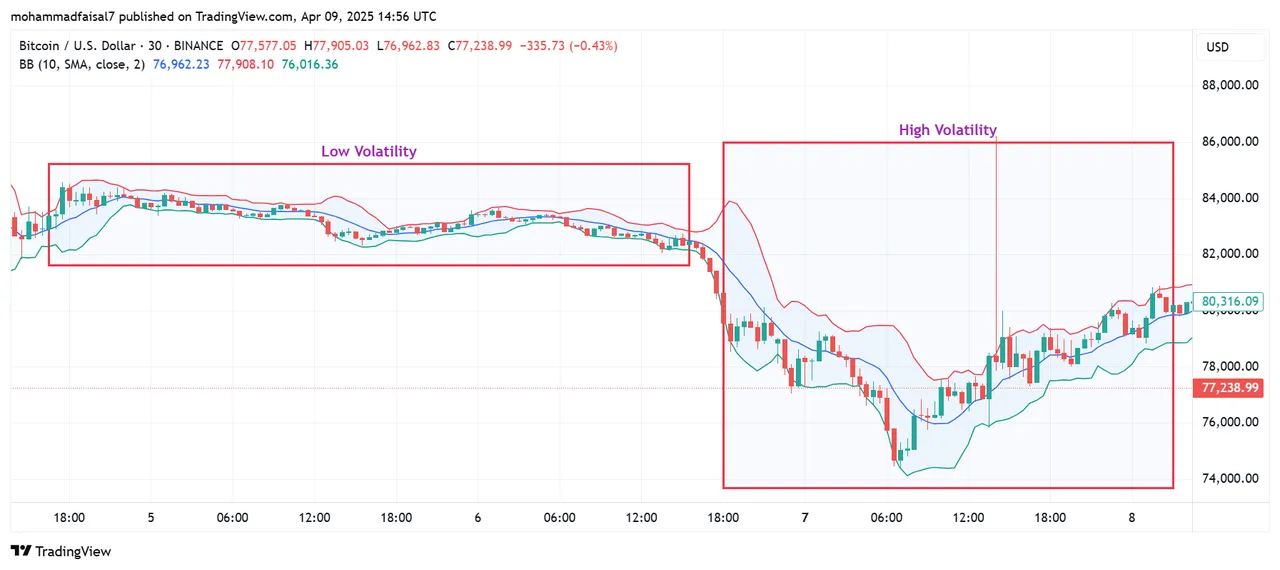
The gap between the upper and the lower band represents the volatility in the market. If the gap between the bands is higher then it shows high volatility in the market. If the gap between the bands is less then it shows the low volatility in the market. Commonly in the consolidation phase where the market moves sideways the gap between the bands is very less and it is the low volatility phase. The price moves in between the fixed levels of the price. After the consolidation phase the breakout happens in the market which can drive the price either in the downward or upward direction depending upon the conditions of the market.
So we can use Bollinger Bands indicator to identify the oversold, overbought, low volatility and high volatility zones in the market and can take our trading decisions accordingly.
Disclaimer: All the screenshots have been taken from TradingView.