Among all the tools that we can use in technical analysis in trading, moving averages are one of the most frequently used, but to know how to use its properly, you have to understand its properly.
What are Moving Averages?
Some traders consider moving averages as a technical analysis indicator, such as the RSI, the ADX, the MACD or any other, while many others do not consider its an indicator per se, but rather a simple tool to see what is happening with the price of an asset in the market in a certain period of time.
In any case, and beyond this, I do not intend here to make an extensive or too broad treatise on what moving averages are; Let's just say that they are a way of visualizing the price action of an asset through an average that is represented in the form of a line on the graph. A moving average is an averaged or weighted expression of the price of an asset, that is, a smoothed way of seeing, understanding and analyzing the price action of an asset in a given period of time.
There are essentially two types of Moving Averages: Simple and Exponential. Now, I am not going to enter here to discuss the mathematical formula of each one in this sense, because for this there is already enough literature on the Internet where you can consult about it; Furthermore, all trading platforms include Moving Averages among their available indicator options.
However, what I will tell you is that the Simple Averages (SMA or Simple Moving Average) are the most basic form of Moving Averages, and are based on the equal treatment of data from the recent period analyzed. Simple Moving Averages are nothing more than the computation of the average value of a given amount of data, where each value is treated in the same way. While the Exponential Moving Average (Or EMA) is a weighted expression of the price, where recent data take on greater weight in the presentation of the line that represents them.
In any case, today I have decided to teach you exclusively about the type of Moving Averages that, personally, I use the most; and what else most traders use in their trading operations: Exponential Moving Averages.
But first, let's see what we can visualize in the graph of an asset thanks to the Exponential Moving Averages...
What kind of information can the use of Exponential Moving Averages provide us?
I want to add that the fact that I prefer to use Exponential Moving Averages over Simple Moving Averages does not in any way mean that the former are better than the latter, I simply use EMAs because, due to their characteristics, they better fit the type of trading that I do, according to my understanding of the markets. Technically speaking, by their mode of calculation, Simple Averages are a more delayed expression of price action, while Exponential Averages are a faster and more sensitive way to see any changes in this regard. Although I must also clarify that both SMAs and EMAs are, by definition, lagged expressions of price action.
Having said this, I clarify then that thanks to the Exponential Moving Averages, we can see many things regarding the behavior of an asset at the graph level, such as: Trend, directionality and Supports and Resistances.
Set and configure the Exponential Moving Averages graphically:
I will now teach you how to set Exponential Moving Averages on the chart of any asset. For the purposes of this post I will use TradingView:
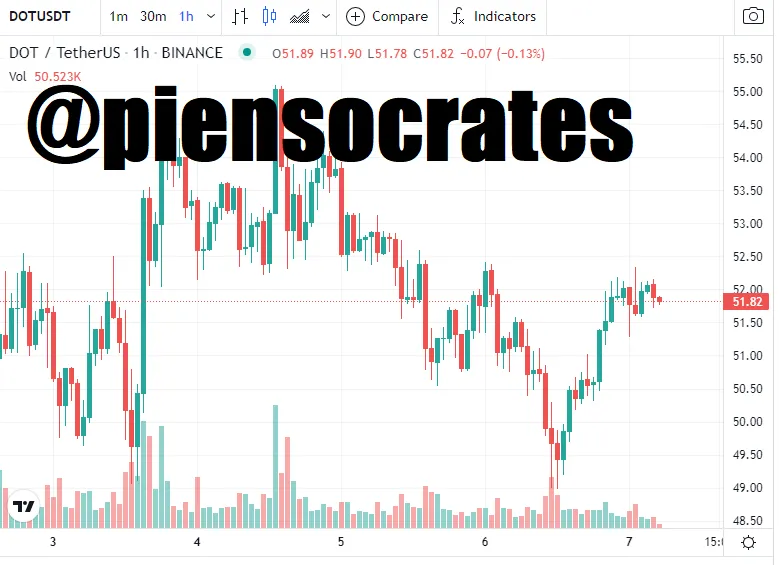
In the first place we select any graph of any cryptoasset, I have chosen the Polkadot graph (DOT).
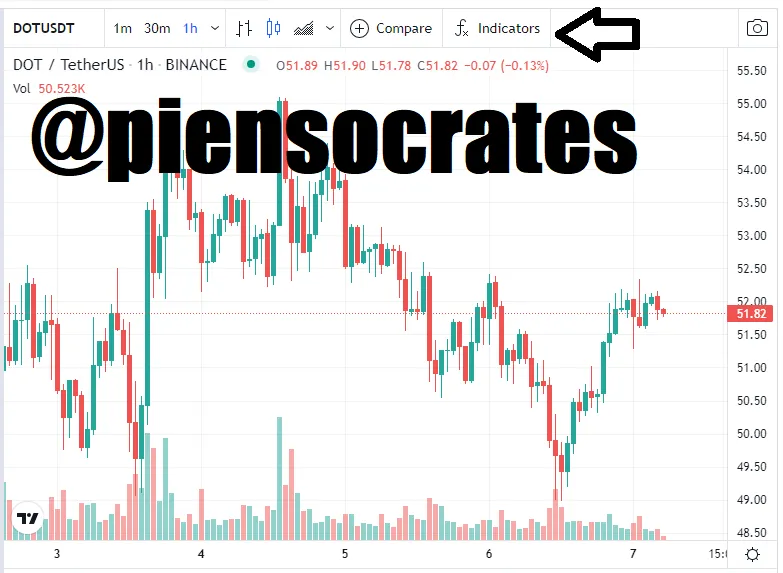
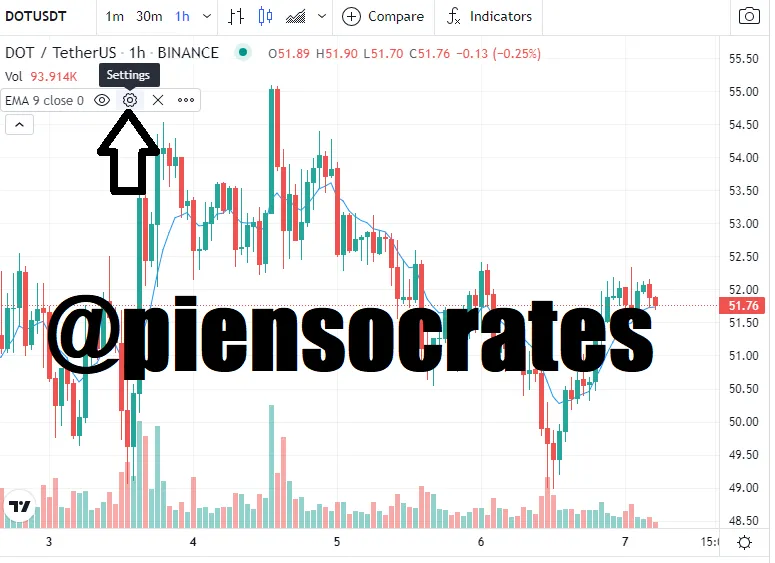
Second, I click where I show you in the image (in the field of indicators):
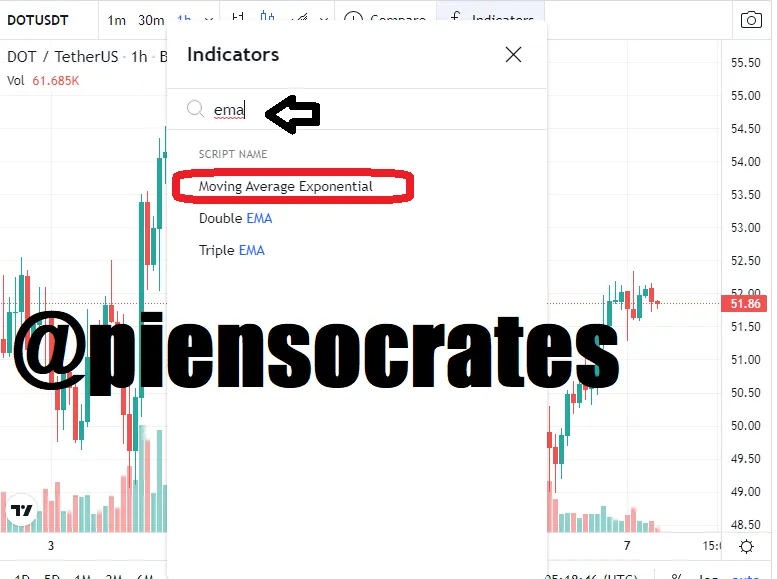
Third, in the box that appears (in the search field) we write "EMA" and then we click on the option "Exponential moving average".
Once the aforementioned is done, we will see the Exponential Moving Average in our graph:
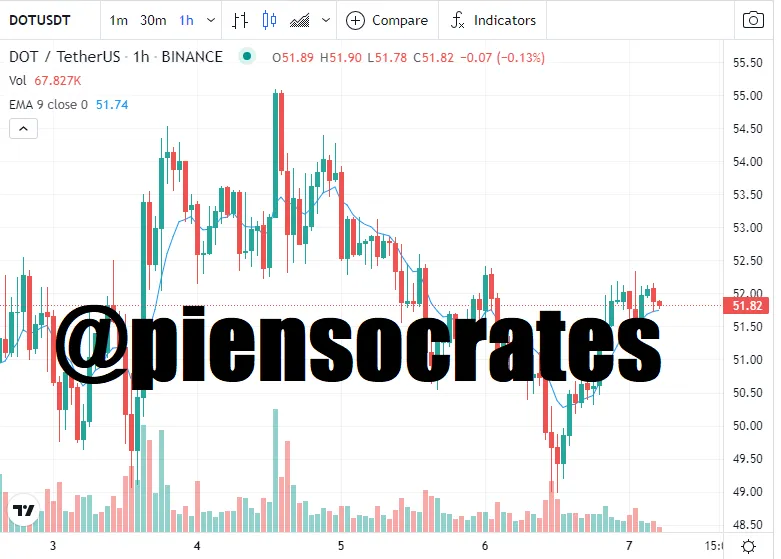
In the image that you have just seen, you can see that it is the blue line is attached to the price, and it configurated in a standard value of 9 periods.
Well, one of the most important things we can do is define the number of periods that we want our Exponential Moving Average to have, but once we have it clear, we must configure it to change the number of periods that it brings preconfigured. We can also, if we want to, change the color and thickness of the line itself.
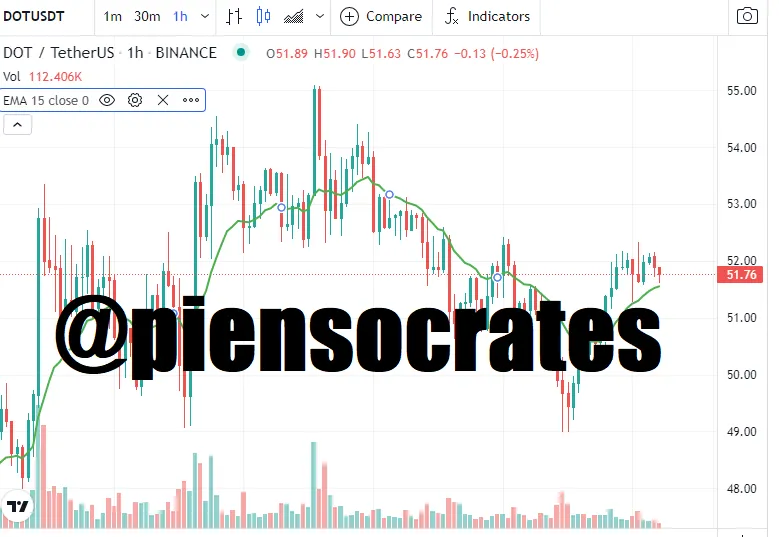
Suppose I want to set my Exponential Moving Average to be 15 periods, and make the line is thicker and green, then I select where I mark with the arrow:
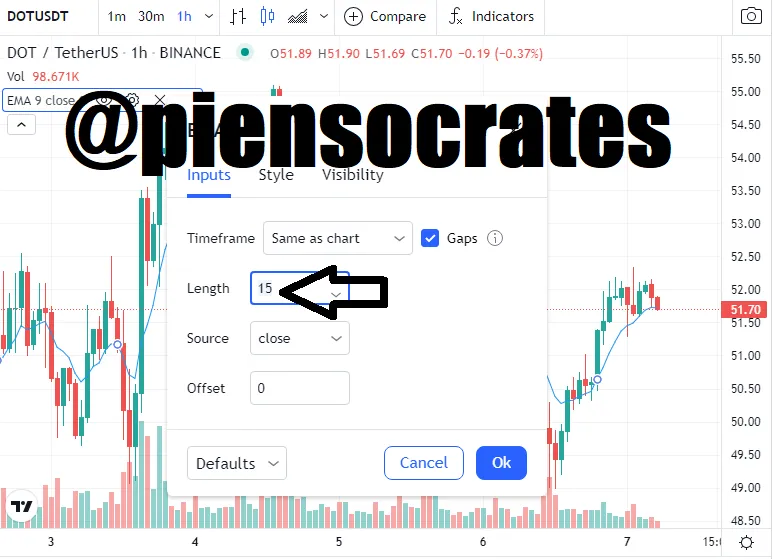
In what appears next, in Inputs, I put the value of 15, to define the 15 periods that is the value I want my EMA to have.
Then in "Style" I choose the green color and the thickness of the line:
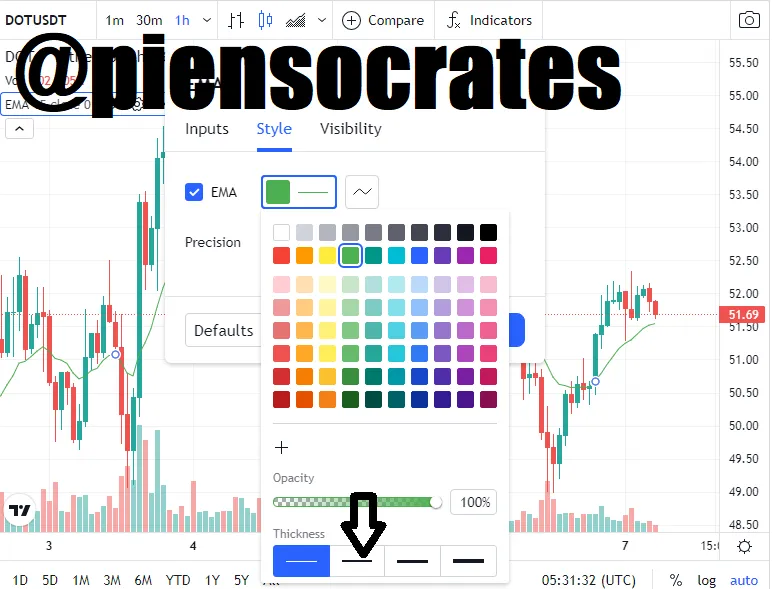
And clicking OK, you will see the results of the changes in the graph respectively:
Using Exponential Moving Averages
Now, normally, traders in a graph usually uses at least two Exponential Moving Averages configured with different number of periods and represented by lines of different color, however, I will explain my particular system that consists of using three Exponential Moving Averages respectively.
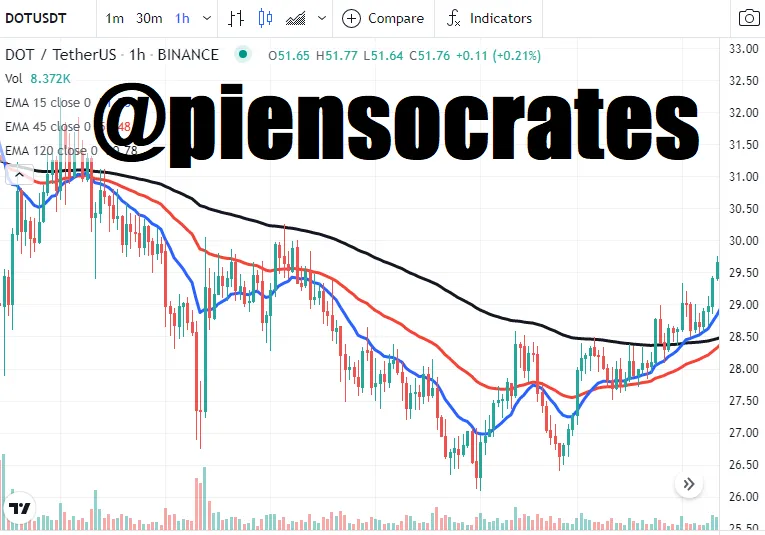
Moving Averages can be used in charts of any asset and, virtually, in any time frame that we want; so I have set to use it on the 1 hour DOT chart.
I establish and configure three Exponential Moving Averages. One of 15 periods, and the other two of 45 and 120 periods respectively. I configure the 15-period one with a blue line, the 45 one with a red line, and the remaining one with a black line. Also, I have thickened all the lines.
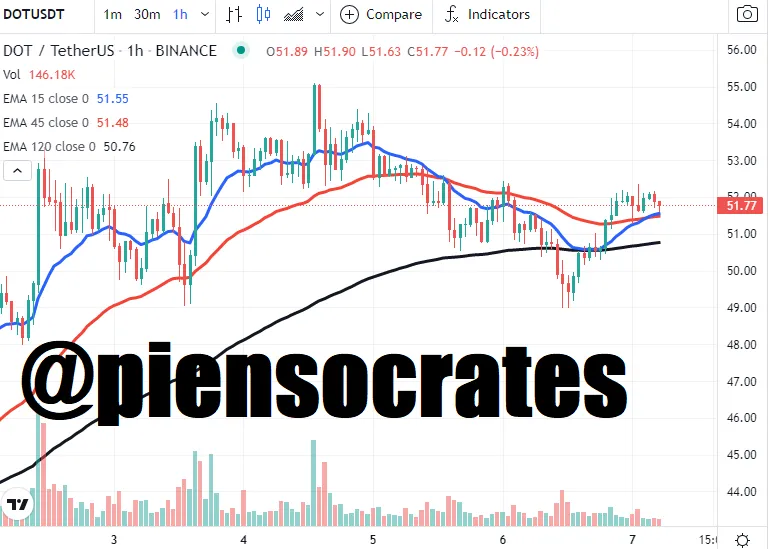
To explain the system in simple terms, every time the fastest moving average - the 9-period moving average - passes above the 45-period one, then the price directionality is bullish, while if the opposite happens, it is bearish. If both mentioned Moving Averages are acting on the Black line -or Average of 120 periods- then the trend is bullish, but if the opposite happens, the trend is bearish.
So, to put it in even clearer terms: The Blue and Red lines themselves define directionality, depending on the movement it show towards each other; while the action of those lines in relation to the black line, define the trend. What it mean that if the action of the blue and red lines happens above the black one, the trend is upward, but if it happens below it, then the trend will be downward; and this will be the case no matter how the blue and red lines are interacting by themselves, since its only indicate immediate directionality in terms of this system that I explain to you.
In the part of the graph that you see above, you will see that the DOT market was in an uptrend together with upward directionality at the same time. The price confirmed it by rising until the directionality lines crossed each other.
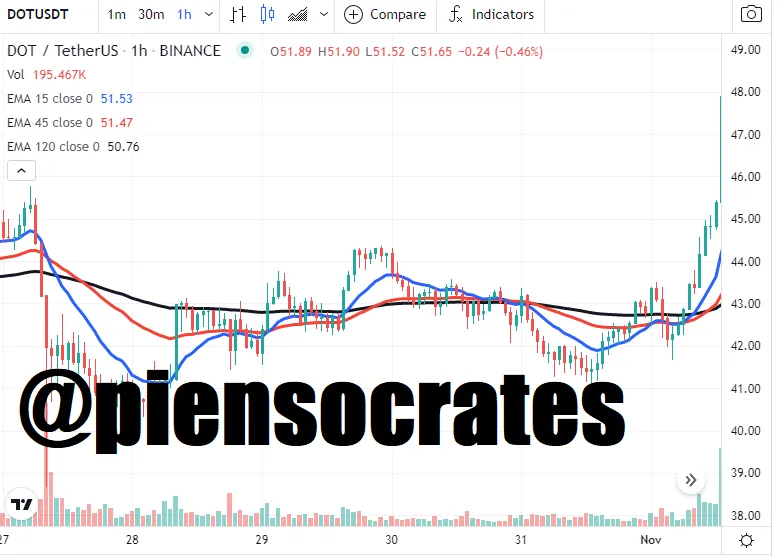
Interestingly, the EMAs also allow us to visualize cases in which the price is pigeonholed in some range, as you can see in the image below:
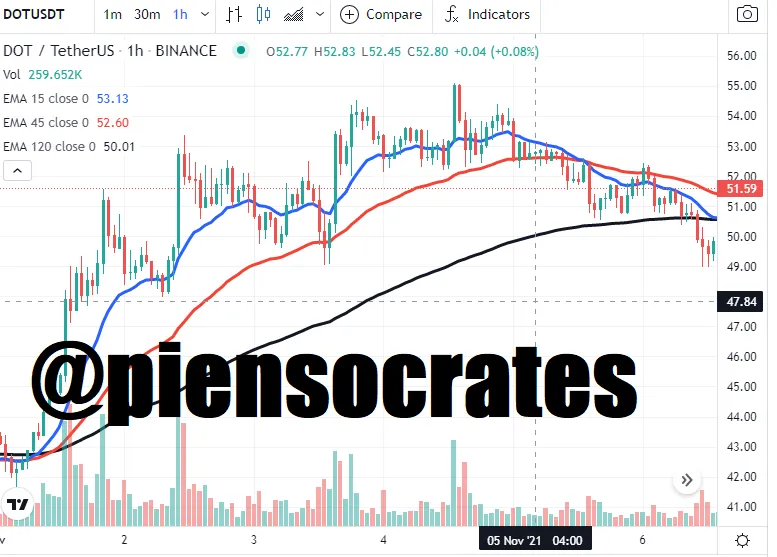
And as an example of the behavior of the Moving Averages in the case of a downward trend and bearish directionality, we have what you can see below:
As you can see, it is all very simple to understand, the case then is that the Moving Averages are used, as I already mentioned, to understand the trend and the directionality that the price of the cryptocurrency brings in analysis; but they also serve to fix support and resistance points. For example, if the price directionality is bullish, then we can take the fastest line as a point of dynamic resistance while we assume the slowest line as a point of dynamic support, the same applies to the opposite case, which means that if the directionality of the price is bearish, we take the fastest line as a dynamic support point and the one that follows it as a dynamic resistance point.
Everything explained is essential in trading, because as we well know, traders have to operate in favor of trends, and go in the direction in which the market is going on to be able to aspire to profits; so for those who do not know the Exponential Moving Averages yet, now you know a way to use them.
Please, comment your opinions on the subject discussed. See you!!