The distribution of Hive Power has remained broadly similar for the three weeks from end December to January 20th.
I use @arcange's stats to produce these reports. The latest report is from 20th January, so whether these are now a thing of the past I don't know.
Maybe he's got a 'live' version planned? That would be nice!
I use the without delegation stats below. @arcange also produces the with 'delegation' distribution, but delegation is just 'patronage', not ownership, so I prefer to look at the 'owned' weightings, I think they're a more valid measurement of power distribution, which is what I'm interested in.
This analysis doesn't take account of the millions of liquid HIVE currently not staked in the DAO.
Trends in distribution by MVEST levels
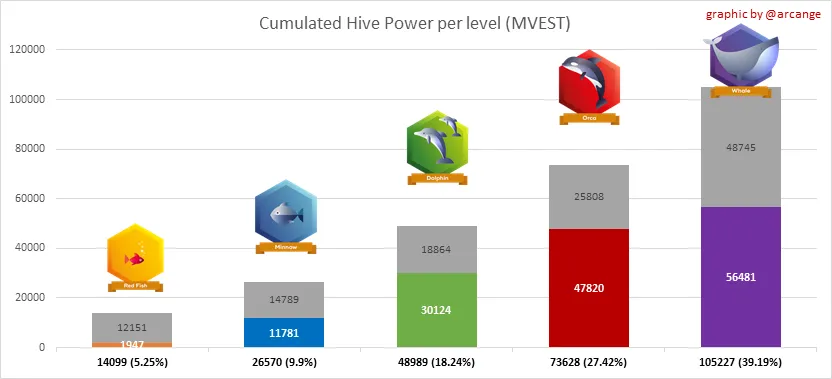
29th December 2020 (without delegation)
20th January 2021 (without delegation)
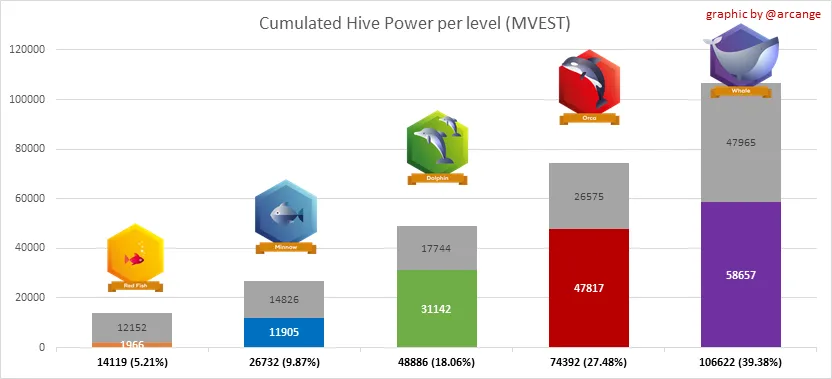
| Level | % total MVESTS 29th Dec | % of total MVESTS 20th Jan |
|---|---|---|
| Whales | 39.19 | 39.38 |
| Orcas | 27.42 | 27.48 |
| Dolphins | 18.24 | 18.06 |
| Minnows | 9.9 | 9.87 |
| Redfish | 5.25 | 5.21 |
Trends in distribution by number of accounts
29th December 2020

20th January 2021
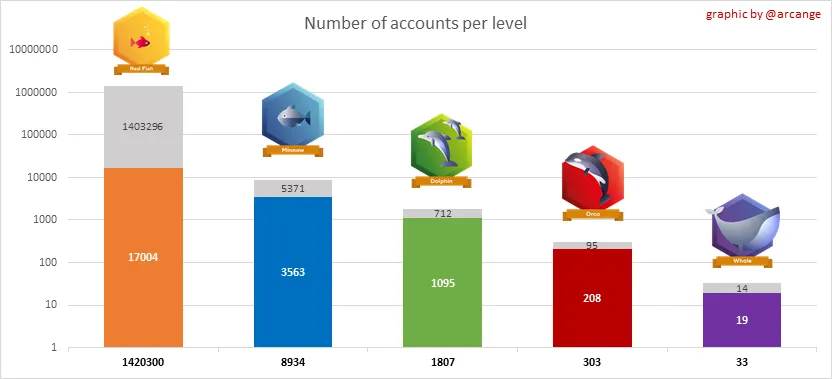
| Level | No. of accounts 29th December | No. of accounts 20th January |
|---|---|---|
| Whales | 32 | 33 |
| Orcas | 302 | 301 |
| Dolphins | 1820 | 1807 |
| Minnows | 8903 | 8934 |
| Redfish | 1415465 | 1420300 |
Commentary/ Analysis
We've seen a slight increase in Hive Power at the top end, and a slight decrease at the bottom end, so another slight slide to more inequality.
Still no evidence yet of 'the masses' flocking to Hive and powering up, but I'm sure that's just around the corner!
Notes...
I set @arcange as a beneficiary!
Sources: