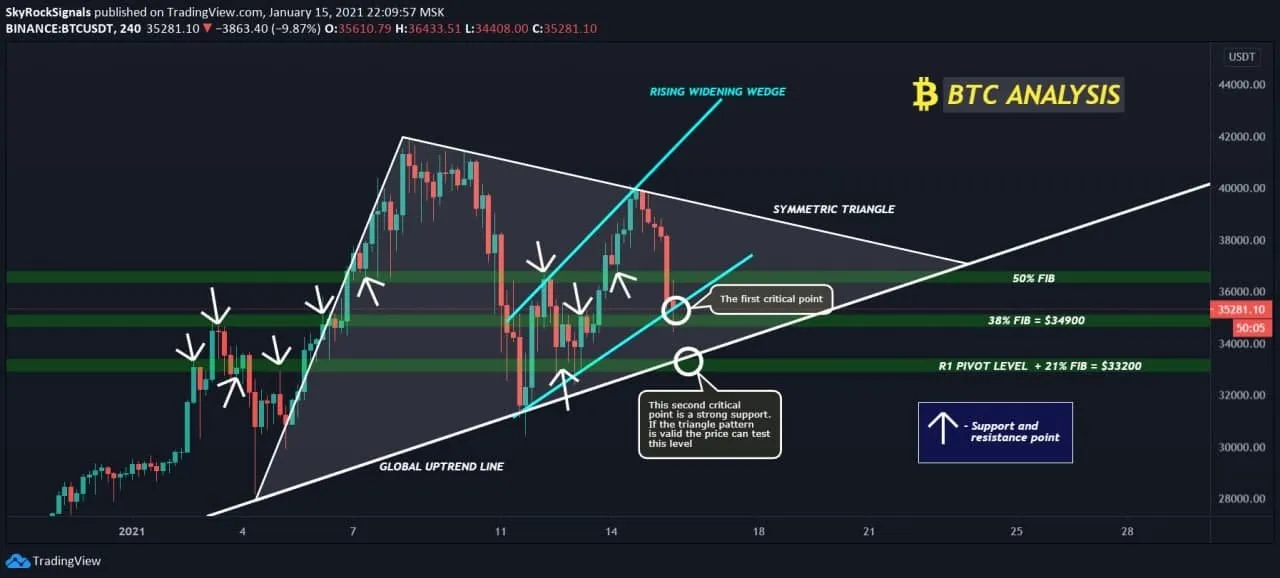
We can see that the price broke down the 0.5 Fibonacci and bounced off the 0.38 Fib level of $34900. There are three green lines which are significant levels of support and resistance (the white arrows demonstrates the support/resistance points).
Globally there is a symmetric triangle pattern, which lower band coincides with the global upward trend line. The really strong support is the $33200, where the lower band, global support and r1 pivot level have a crossover.
Another scenario is the rising widening wedge. Now we can see the bounce off it's lower band. As a result we can potentially see the price growth to it's higher band approximately to the ATH level. If the price is able to break the wedge's lower band down the price can find support next to the $33200 level.