The U.S. stock market has been a bit of an enigma in a covid fueled 2020. Rallying against the odds, mainly fueled by fed money that has to go someone, much of which found its way into the market.
Looking at the monthly chart of the S&P 500 gives us the broad view of price action.
Big Body Candle on Mediocre Volume
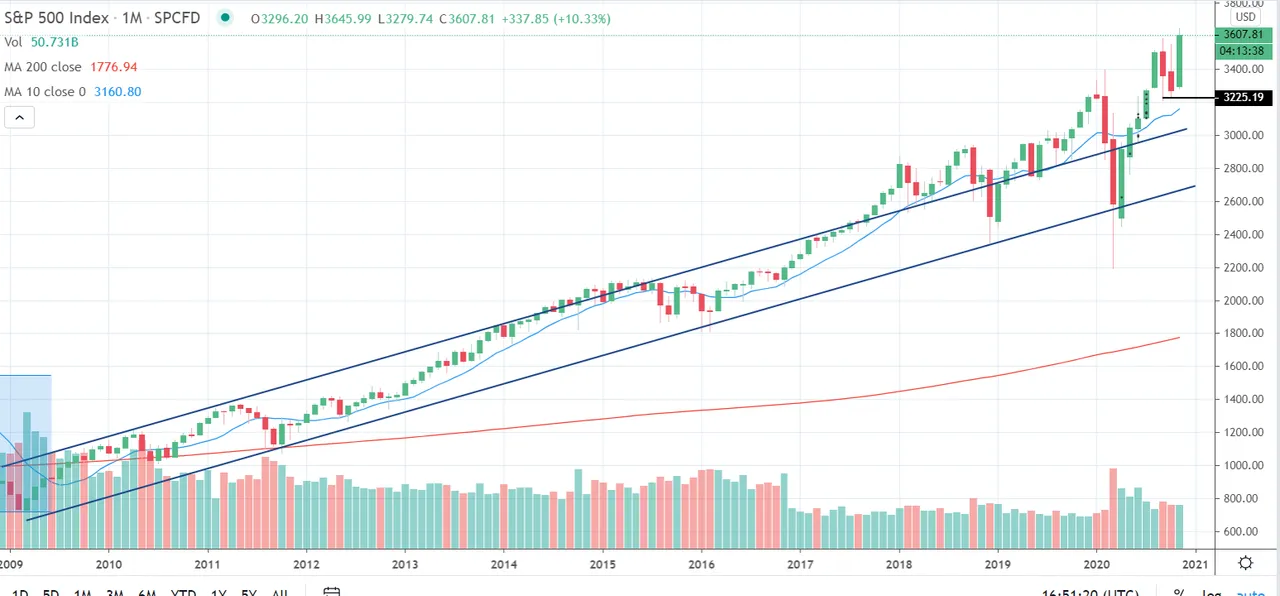
After seeing a pre-election dip in September and October the marker rallied strong once the election was complete, erasing those losses and pushing to fresh new highs.
Where does the market go from here?
I can tell you this. It is not often we see a big green monthly candle with two preceding red candles where the next month is not green.
The simple explanation of the above statement is odds are December will be a green monthly candle. Doesn't mean it will, but the odds favor it.
Just looking at the last 10 years, we are hard pressed to find scenarios where this is not the case.
But things look overbought and due for correction
I agree, looking that the chart above the S&P 500 is well above the 10 period average.
We can also see that at some point that average always catches up, whether it be from the market correcting or just consolidating in a sideways pattern.
It puts one in a quandary for sure. I mean, how to you get long here? If you are already long I supposed one should ride the wave, but adding new longs here is a tough sell for me.
In fact, the S&P 500 is currently further away from the 10 period moving average by more than it ever has been in the past 10 years. You would think something has to give but....
The Market can Stay Irrational Longer than you can Stay Solvent