For about two years, I did a monthly report on Steem called "STEEM: Whales Are Losing Their Power....The System Is Not Broken". This took a look at how the distribution of Steem Power changed on a monthly basis. The presumption on there was that the Whales were just getting more powerful when the reality showed the exact opposite. When it came to Steem Power, over a two years period of time, things were flattening out.
Of course, we know that Steemit Inc selling part of the stake each month had a lot to do with it. Unfortunately, as we found out, not enough was sold.
I decided to bring this report over to Hive so that we can monitor how things are going. I am going to use the first chart I have from Steem as the initial basis since Hive has its roots there. The chart is pertinent for all categories other than the Whales since we know that is much different than on Hive due to Steemit Inc.
These are the numbers through November 30, 2020.
Each month I monitor what is going on with new accounts and the amount of MVests in each category. I do this to determine what trends are taking place.
Now that we are at end of month, time to post the numbers again.
I want to thank @arcange for the work done each day compiling these numbers and making the charts.
We will be showing 3 months worth of data for analysis purposes to see how the 90 trend might be.
The first chart is from August of 2017, the month I started on Steem. It is placed here to provide some contrast to see how things are changing over a longer period of time.
Here is the breakdown.
8/1/2017
The total MVests here is 336,932.
On a percentage basis:
Whales 75.44%
Orcas 14.86%
Dolphins 7.16%
Minnows 2.14%
Red Fish .01%
Inactive .40%
9/30/2020

@arcange/hive-statistics-20200930-en
The total MVests here is 267,912.
On a percentage basis:
Whales 38.65%
Orcas 27.52%
Dolphins 18.77%
Minnows 9.79%
Red Fish 5.28%
The change over that time period is as such:
Whales +4.6%
Orcas -3.47%
Dolphins -2.14%
Minnows -2.1%
Red Fish -1.68%
10/31/2020
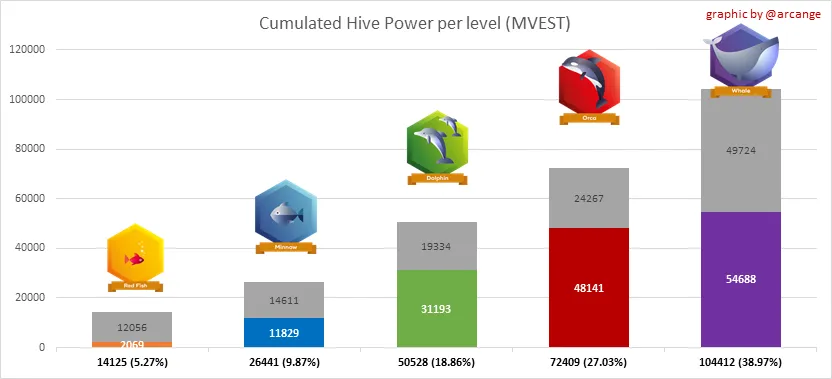
@arcange/hive-statistics-20201031-en
The total MVests here is 267,915 .
On a percentage basis:
Whales 38.97%
Orcas 27.03%
Dolphins 18.86%
Minnows 9.87%
Red Fish 5.27%
The change over that time period is as such:
Whales +.83%
Orcas -1.78%
Dolphins +.48%
Minnows +.82%
Red Fish -.19%
11/30/2020
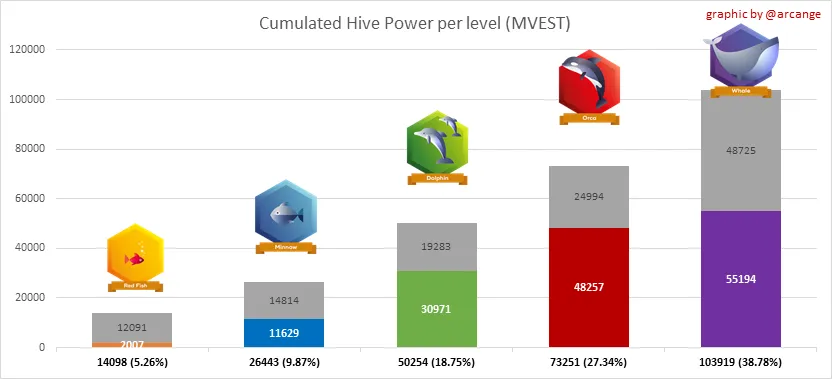
@arcange/hive-statistics-20201130-en
The total MVests here is 267,965 .
On a percentage basis:
Whales 38.78%
Orcas 27.34%
Dolphins 18.75%
Minnows 9.87%
Red Fish 5.26%
The change over that time period is as such:
Whales -.52%
Orcas +1.15%
Dolphins -.58%
Minnows 0%
Red Fish -.19%
9/30/2020

10/31/2020
11/30/2020
This was a very good month for the distribution.
The Orcas were the only ones to gain. They were up, as a group, over 1%. Every other category was down except for the Minnows who were basically flat.
It was a near tie with the Whales and the Dolphins both being down a bit over .5% for the month as compared to this time a month ago.
Those numbers only tell part of the story. Between the two groups, the Dolphins actually did well. They were down, as a percentage of the whole, because 4 graduated to Orca (the Whales lost one who moved down to Orca). In spite of that, they were able to add 6 new members, net. That means we saw 10 accounts enter into the Dolphin level.
The reason why Dolphins gained in number yet lost in percentage of the overall is because those move out of Dolphin status had 10 times the amount of MVest as those entering. Thus, to remain equal, 40 new Dolphins would have needed to be minted.
On September 30, 2020, the Whales and Orcas had 177,255 MVests (66.16% of the total), an increase of 1.03%; On October 31, 2020, 176,521 MVests (65.99 of the total), a decrease of .26%; on November 30, 2020, 177,170 MVests (66.12% of the total), an increase of .19%.
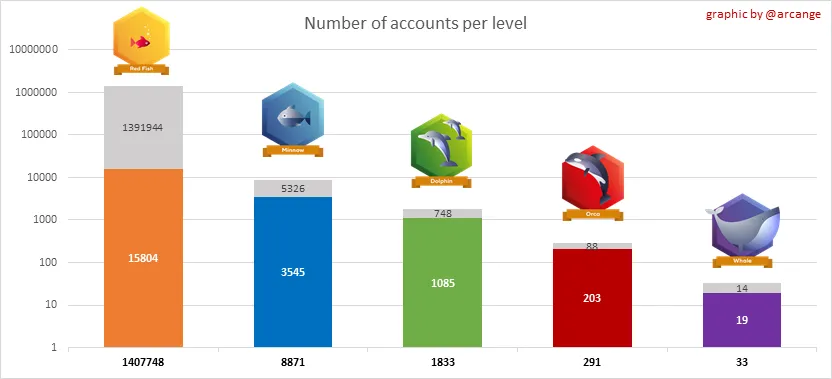
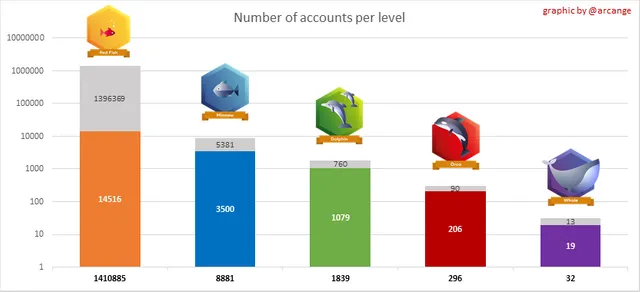
It is good to see an uptick in the total number of accounts at each level.
For the 60 day period, we saw this:
Orcas +5
Dolphins +20
Minnows +38
This tells me that many accounts at the lower levels are working at adding HP and growing. The system seems pretty consistent in the results. Over time, more accounts enter the different categories while amassing more influence.
The only drawback is the number of accounts we are dealing with. Greater onboarding success would likely result in a faster shift in these numbers.
If you found this article informative, please give an upvote and rehive.

gif by @doze